


PRICE $1,000
1. Quantum Queen EA MT5 is one of the most aggressively marketed Expert Advisors on the MQL5 marketplace — and its sales page is a masterclass in convincing potential buyers that they are about to purchase something truly exceptional. 531 reviews, a 4.97 rating, eloquent self-descriptions like “the undisputed Queen of XAUUSD” and “consistency is my legacy.” But behind all of this marketing polish lies a very uncomfortable truth that the developer goes to great lengths to avoid mentioning: a standard full-period backtest destroys the deposit completely. Let’s look at what the numbers actually say.

PRICE $1,000
2. WallStreet Forex Robot 3.0 is our flagman trading system, which we are continuously improving, updating and perfecting well over 10 years. If you want to have any chance to profit from FOREX trading, you must use the strongest and most repeatable profitable trading pattern in existence. The only way to find such a pattern is to code and test thousands different strategies and perform tens of thousands back-tests, which is impossible for any manual trader … but this is what we did. This is the reason, why using a rigorously tested, proven profitable automated system is by far the best way to grow your account. Our experience and knowledge allow us to claim that WallStreet Forex Robot 3.0 is by far the best automated trading strategy on the forex market.
PRICE $1,000
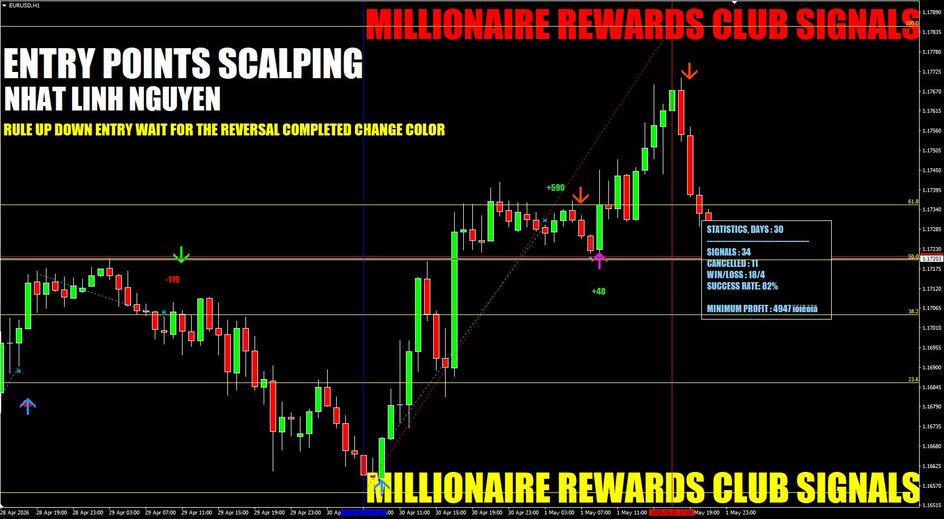
3. Entry Points Pro is a universal and quite accurate indicator for MT4, which can be used for trading on currencies, crypto, metals, stocks and indices in a wide range of timeframes from M1 to D1. The indicator is characterised by the seller as an ideal tool with the best points for entering a trade, increasing the success rate of trades for 100% of traders. It is not repainted, but still there is a nuance in the formation of a trading signal (read below or watch the video), and also gives signals to enter a trade at any price movement: up, down or flat (sideways) - which looks a bit strange (I mean signals at sideways price movement).
PRICE $1,000
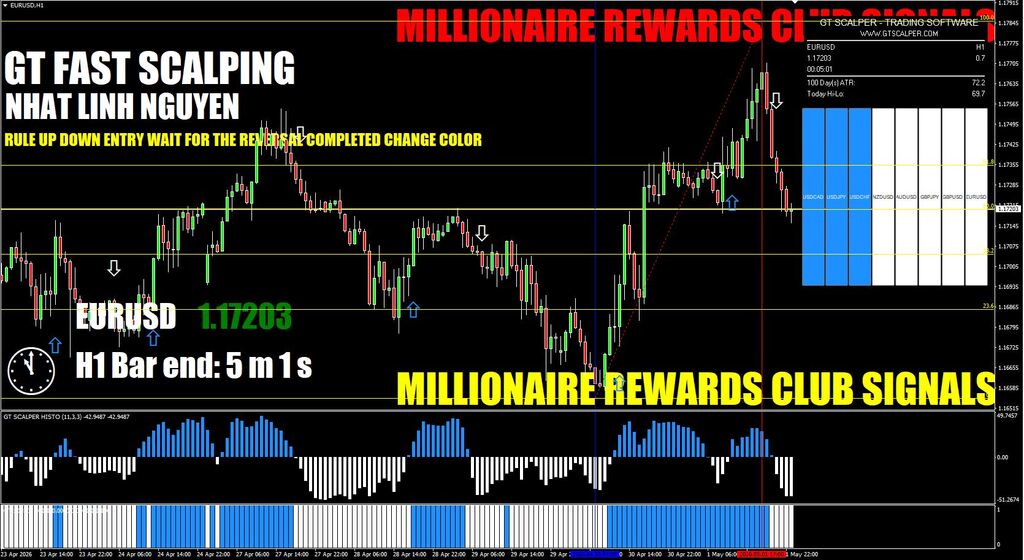
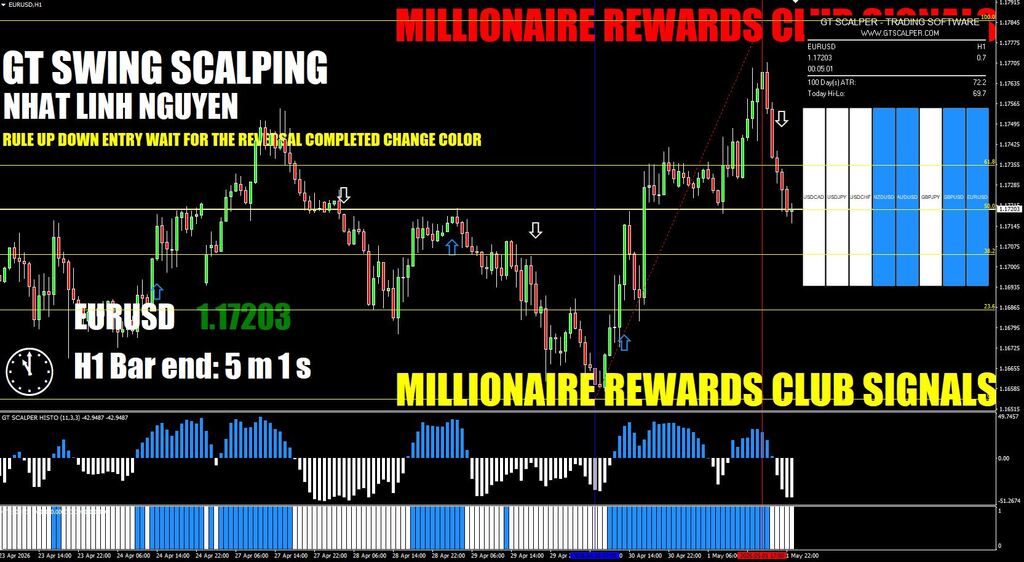
4. GT Scalper will allow you to easily and effectively monitor the price and will not miss the most favorable moment to enter a trade. The system can be applied to various trading styles and is not afraid of repainting.
PRICE $1,000
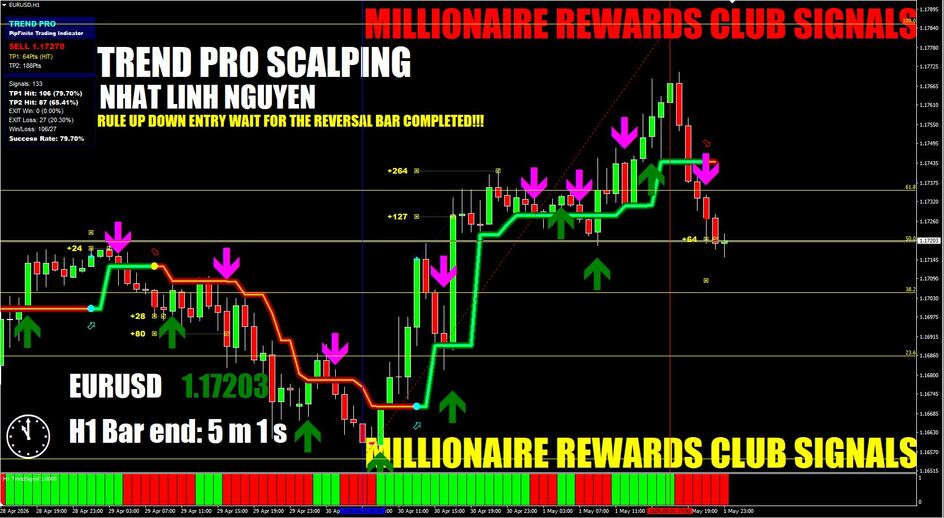
5. Trend PRO Indicator is a smart algorithm that accurately detects a trend, removes market interference and creates input signals and levels for automatic output. Uses a breakdown strategy combined with trend trading and, of course, 100% does not repaint.
PRICE $1,000
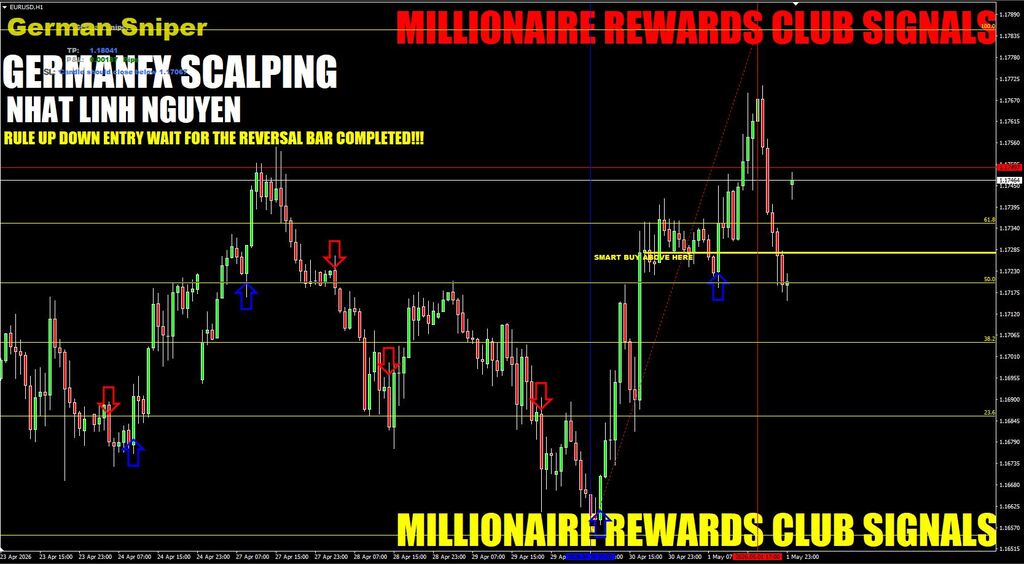
6. German Sniper Indicator earn at least 50 pips per day. German Sniper Indicator uses algorithmic market analysis to generate entry points in safe zones so that we can open trades with minimal drawdown. These are all beautiful words of the sellers of this miracle of the forex industry. What exactly is the German Sniper Forex Trading Indicator?
The developers position this indicator for intraday trading and, if possible, on Nas100 and German30. But I think this is not essential, and it can be successfully applied in other trading styles (scalping, swing) and other trading assets, such as major currency pairs. The indicator is not repainted, only the Take Profit level can change when the price approaches it.
The indicator is easy to use and when you attach it to the chart, you will immediately receive the current trading signal with the entry point and TP. Also in the corner, the indicator will calculate the current Profit/Loss (P&L). It's comfortable. But you won't be able to change anything in the indicator, since its settings are not available.
Thus, to enter a trade, we only need to wait for the indicator signal and follow it.
PRICE $1,000
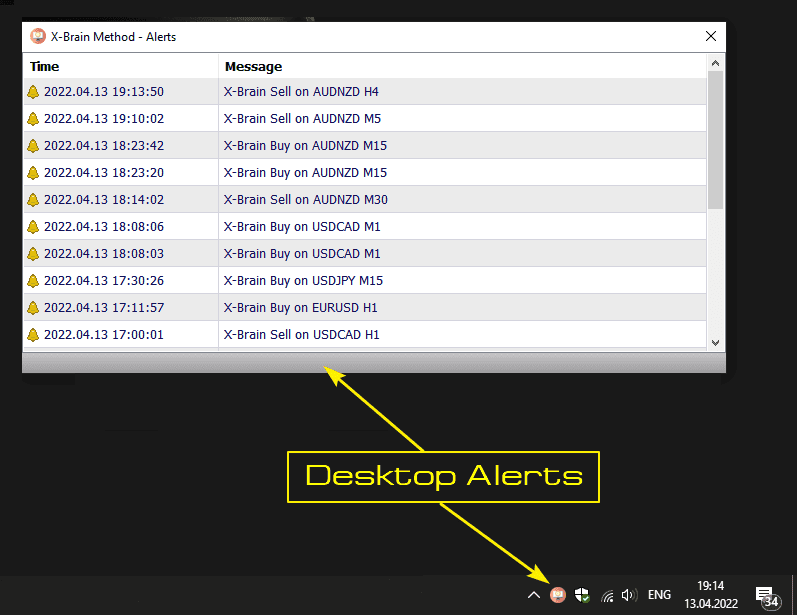
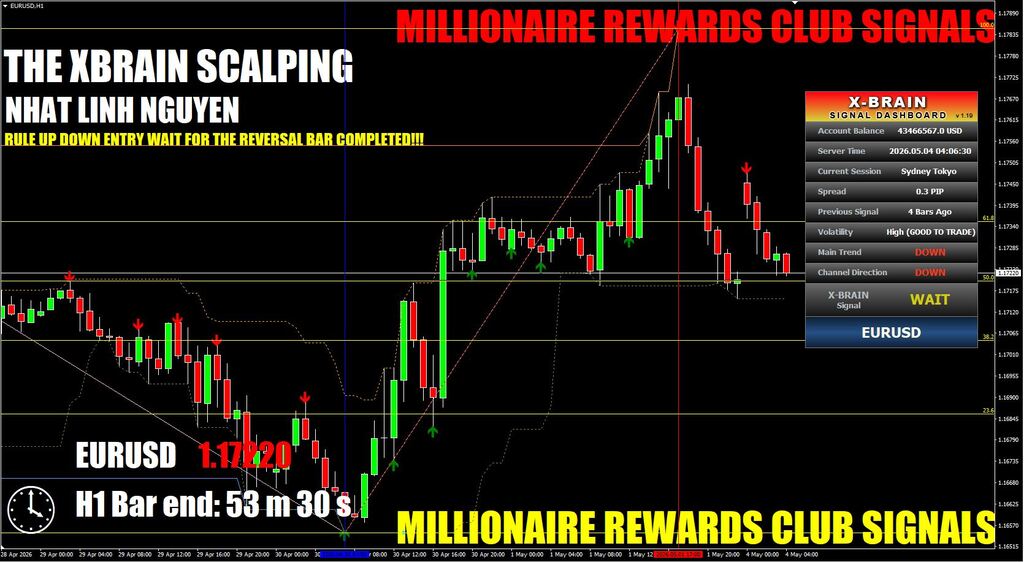
7. X-Brain Method is a trading system, like most other systems, based on price action patterns and channel breakouts, and in fact is a kind of symbiosis of standard Metatrader 4 indicators. The system has a convenient and intuitive interface that even an inexperienced trader will understand. Developers selling this “goose that lays golden eggs” for $1,000 claim that the accuracy of the signals is 96%!!! Just the Grail?!
The indicator has an informational dashboard, which performs not only an informative role about the account balance, spread, current session, etc., but is also a trading filter that indicates the current direction of the main trend and the direction of the price channel. In addition to the signal dashboard, the indicator has signal arrows (as market entry points) and channel lines, which have an auxiliary role and can be used as a tool for setting trading targets and Stop Loss.
This is a trend trading system, so just one arrow with an alert will not be enough for us to enter a trade. For maximum signal accuracy, I recommend matching the direction of the signal with the direction of the main trend and the direction of the channel. So you can protect yourself from false signals (but this does not mean that they will not be at all).
Buy Signal:
- Green Arrow + Alert
- Main Trend – UP
- Channel Direction - UP
Sell Signal:
- Red Arrow + Alert
- Main Trend – DOWN
- Channel Direction - DOWN
PRICE $1,000
8. Erudite Scalper is a symbiosis of two components, one of which determines the prevailing trend and the second, which finds the entry point. This combination of a sophisticated algorithm that determines whether the market is overbought / oversold and its dominant direction with no repainting gives us a good tool for profitable trading.
First confirmation:
The red / blue background indicates the current prevailing trend direction. Red background color - bearish trend (we consider only sells, ignore buy signals). The blue background color is a bullish trend (we consider only buy signals, ignore sells).
Second confirmation:
A signal in the form of a blue / red bar, as a result of determining whether the market is oversold / overbought, is a direct signal to enter the market.
Buy Signal:
- The background of the indicator is blue (we consider only Buy signals)
- A Buy signal appears - blue bar appears
Sell Signal:
- The background of the indicator is red (we consider only Sell signals)
- A Sell signal appears - red bar appears
In addition, the opposite indicator signal (red or blue bar) can be used to exit a trade.
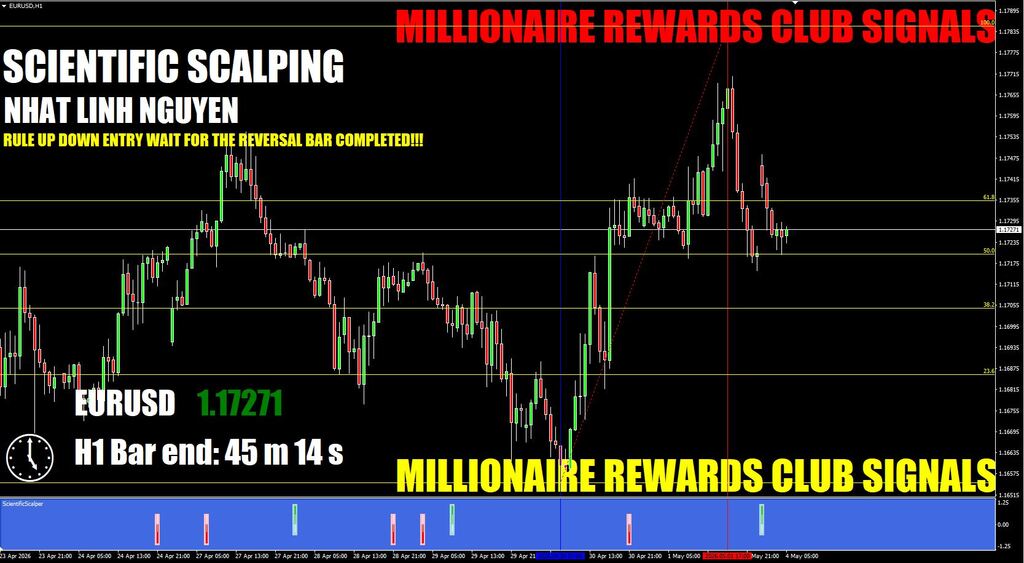
The indicator can be used alone or it can be an add-on to your system. The author offers his trading strategy based on Scientific Scalper. To do this, he suggests using a 4-hour TimeFrame as an additional filter to confirm signals on M15. If the background color of the indicator is the same on both timeframes, then you can open a deal in the direction of the trend the next time a signal appears.
PRICE $1,000
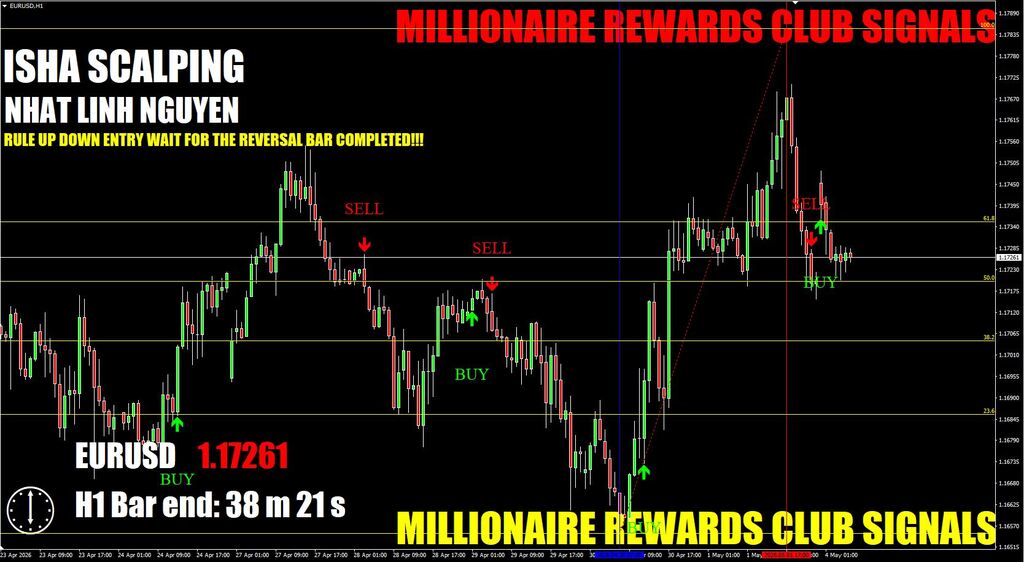
9. ISHA Indicator v.10 is a very easy-to-analyze arrow trading tool with impressive accuracy - more than 70% of winning trades. This indicator has no repainting at all - 100% non-repaint.
Buy Green arrow – open Long position:
Sell Red arrow – open Short position:
Stop Loss should be set a few pips above / below the last local price high / low. To control an open position, you can use a Trailing Stop. Or exit when the opposite signal appears.
Take Profit ≥ 2*Stop Loss.
PRICE $1,000
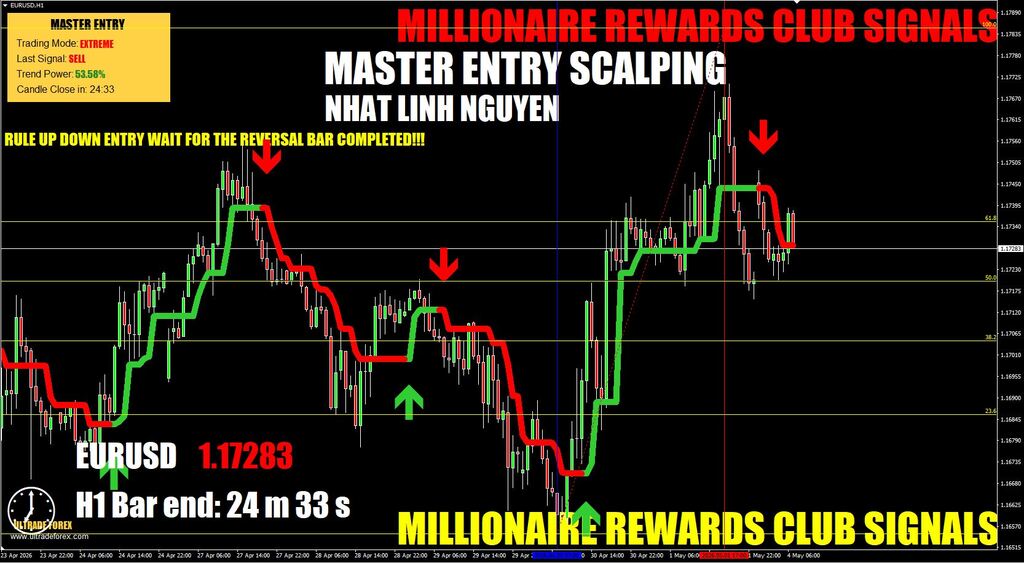
10. Master Entry reduce your trading stress to mininum. Master Entry is a versatile trading indicator suitable for any type of trading, be it scalping, traditional day trading or swing trading. Accordingly, you can trade on any timeframe. And the ease of use of the indicator makes it convenient and understandable even for a beginner. The official website says that the indicator is not repainted, but I have serious doubts about this. We'll deal with this later.
BUY - green upward arrow:
SELL - red downward arrow:
Stop Loss is at the level of the previous local minimum for Buy and at the level of the previous local maximum for Sell.
Take Profit - individually, depending on the volatility of the currency pair, Time Frame and trading session. Or using the formula: Take Profit = 2 x Stop Loss.
Alternatively, to set Stop Loss and Take Profit levels, the author recommends using Fibonacci levels, stretching them from the nearest price maximum to the price minimum.
PRICE $1,000
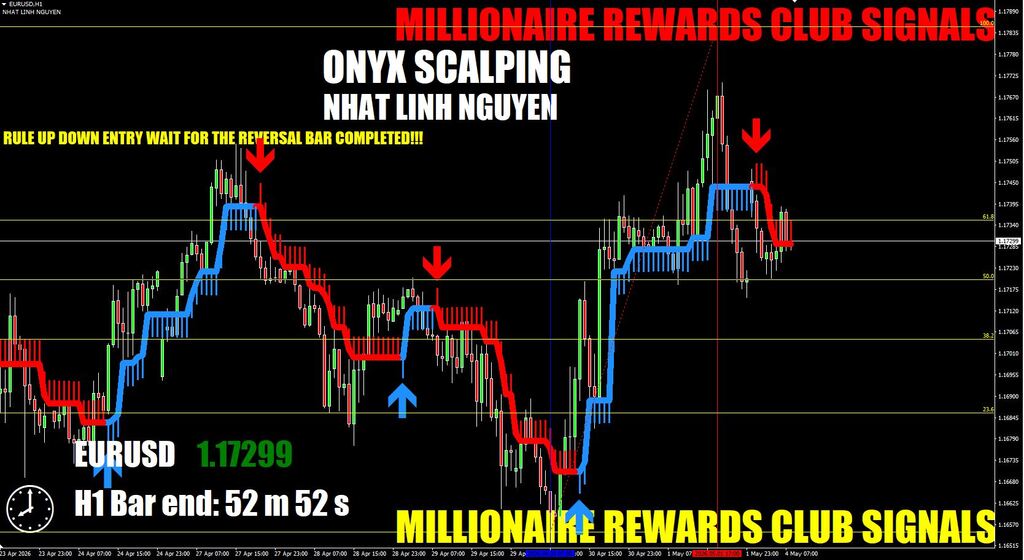
11. Onyx Scalper is another trading indicator from the famous developer Karl Dittmann. The indicator is mainly intended for scalping and, by its simplicity, is suitable for a trader with any level of training. The indicator does not repaint and is not late. It works on any trading assets . You already probably know that most paid indicators are based on a skeleton, which is built on the basis of standard free indicators. And Onyx Scalper is no exception. Its signals are very similar to the HalfTrend indicator, which has long been known to us. Below are some screenshots to confirm my statement. Currency pairs, trading time and timeframe are the same. You already probably know that most paid indicators are based on a skeleton, which is built on the basis of standard free indicators. And Onyx Scalper is no exception. Its signals are very similar to the HalfTrend indicator, which has long been known to us. Below are some screenshots to confirm my statement. Currency pairs, trading time and timeframe are the same.
In the settings of the HalfTrend indicator, the value of the parameter Amplituda = 3 was default setting. Other settings were left unchanged. As this parameter increases, the number of signals decreases, but they are more accurate and smoothed.
Onyx Scalper Indicator is able to find the best entry points. It is very convenient. Because we do not open a deal right away when the color of the indicator changes, but only at the moment the Blue or Red Diamond appears. Thus, the trader has some time to prepare for the opening of the transaction and make the optimal entry:
Unfortunately, there is no information how the indicator overcomes long-term flat. This is a weak point of many indicators. I suspect that Onyx Scalper does not behave in a flat in the best way. Therefore, be sure to use additional filters and trade only in the London and New York sessions on the Major currency pairs. Follow Money Management and take into account the most important (red) economic news.

PRICE $1,000
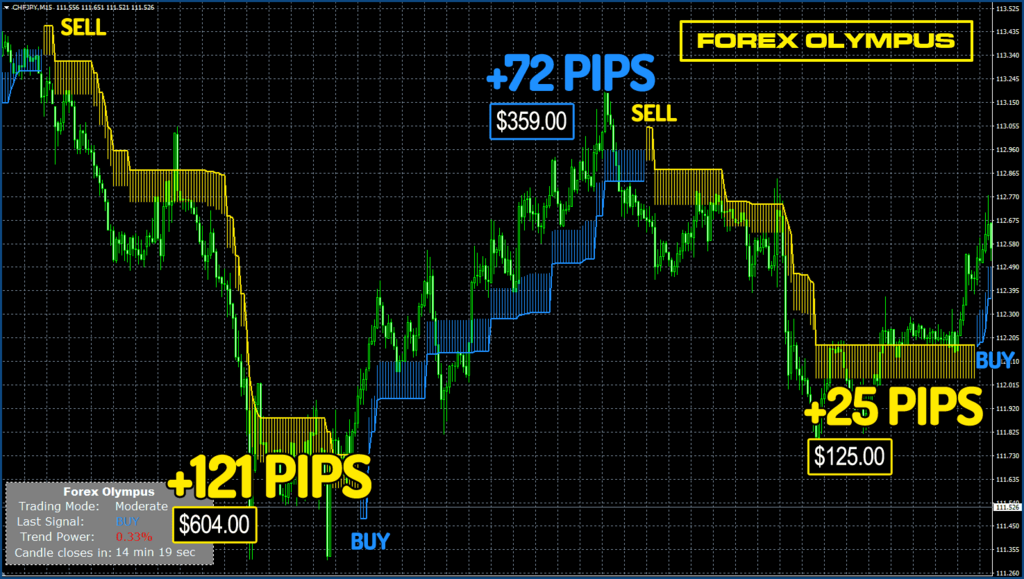
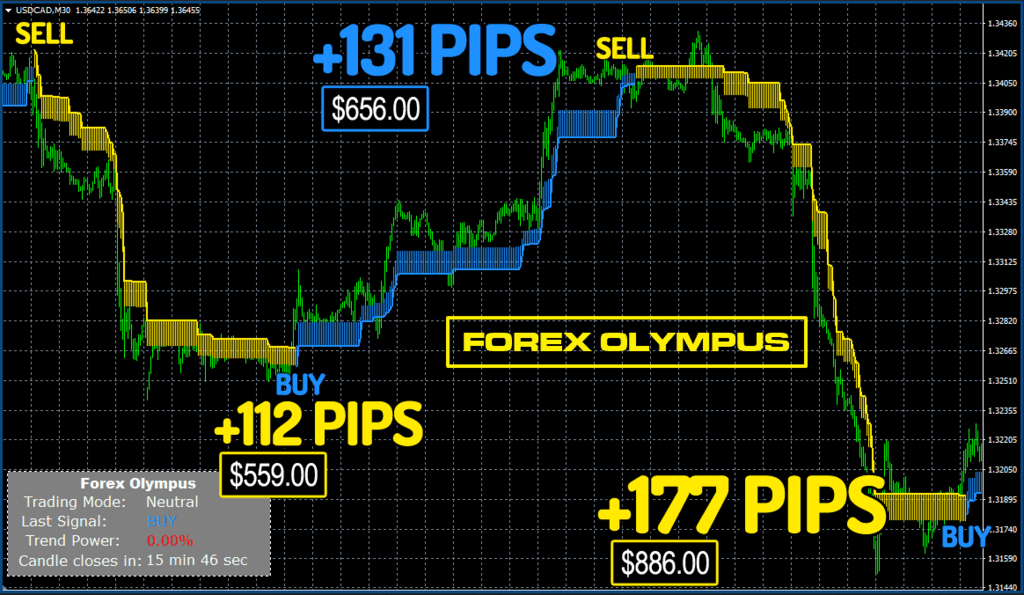
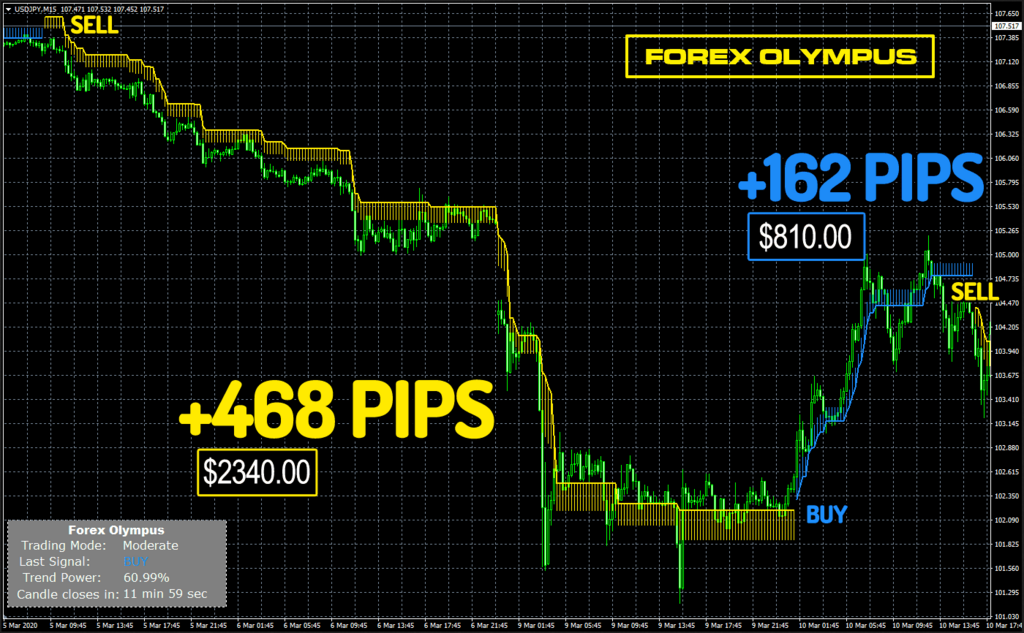
12. Forex Olympus is an indicator developed by Rita Lasker, which is well known to many traders for its products. The indicator is positioned as a trading tool capable of making every trader rich during the coronavirus pandemic. Quarantine is declared in many countries, borders are closed, people are being urged not to leave home. At such a time, it only remains to close the house and trade intensively in the forex market. And Rita Lasker with her Forex Olympus indicator promises to make our trading more successful. This indicator immediately reminded me of the well-known HalfTrend indicator. And I was not too lazy to compare these indicators. And what did I see? If it is not a modified HalfTrend or Ozymandias, then at least they became its prototypes. Rita Lasker is not the only one who used HalfTrend in his designs. The notorious Karl Dittmann also used this indicator as the basis for his Forex Millennium.
In addition, the developers took care of trade automation and for an additional fee you can buy a robot based on this indicator. And then you do not have to sit for hours in front of your computer monitor. However, these are only the words of the developer, not confirmed by facts. Therefore, be sure to check the indicator in trading on a demo account and use additional filters. Be sure to consider the outputs of important economic news and follow the money management.
PRICE $1,000
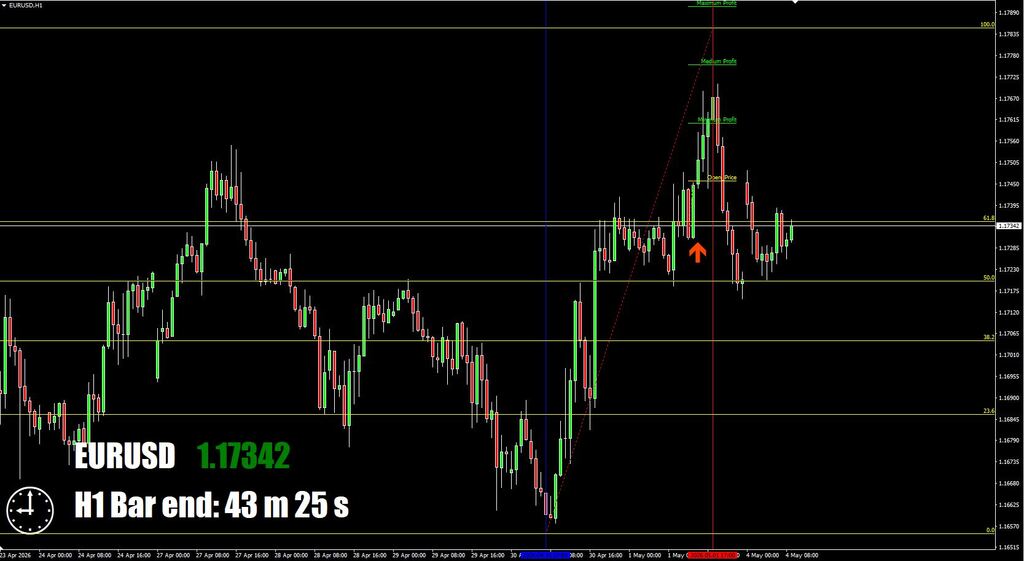
13. Diamond Price Action is an indicator whose signals reach 80-90% accuracy and are not repainted or late. Signals appear at the opening of a new candle and calculate 3 levels of targets, which greatly facilitates trading. As I understand from the description of the principle of the indicator - it finds the 6 best Price Action Patterns (Rising Star, Fallen Star, Light in Clouds, Dark Veil, Three White Soldiers, Three Black Crows). When these patterns are found, the indicator gives Buy or Sell signal. At the same time, the indicator calculates the 3 most relevant profit targets and gives an sound signal. When trading the Diamond Price Action indicator, you only need to follow the signals, open a position and set your Take Profit at one of the specified levels. I recommend - Minimum or Medium Profit. Maximum Profit - for more risky and aggressive trading. You can also use Trailing Stop. Of the indicator settings, only changes in the visualization of some elements (color, size), the assignment of level sizes for Profit Targets, and the on / off alerts are available (Pop Up Alert, Mail and Mobile Notification):
PRICE $1,000
PRICE $1,000
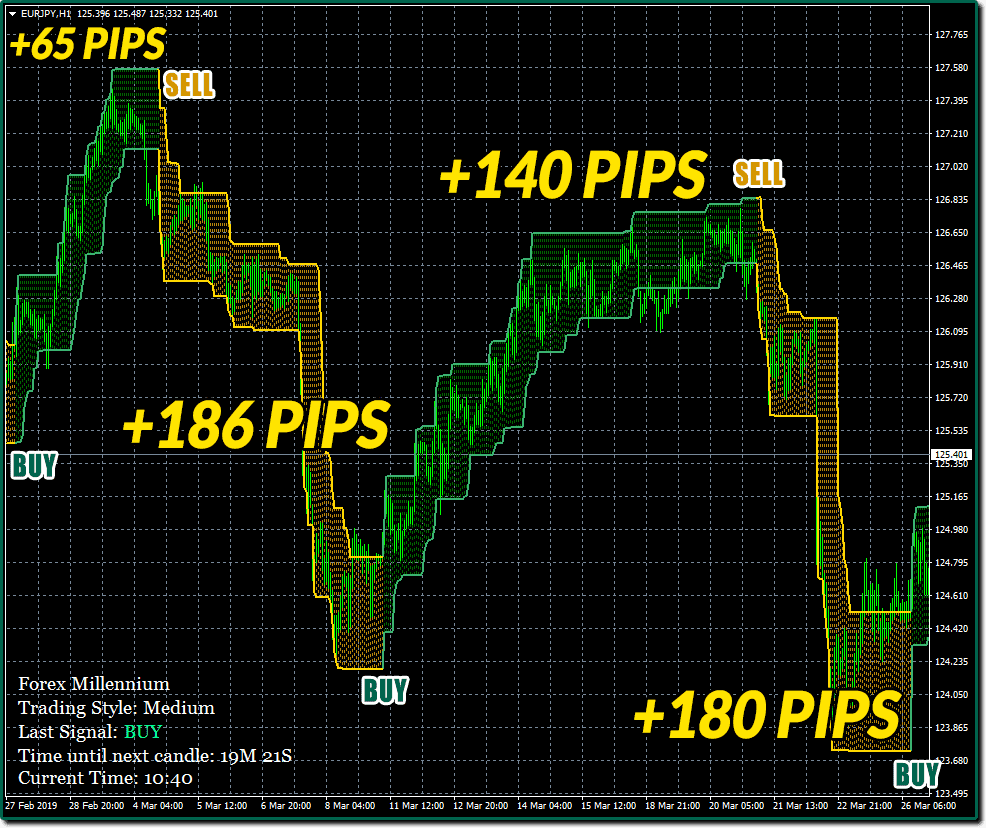
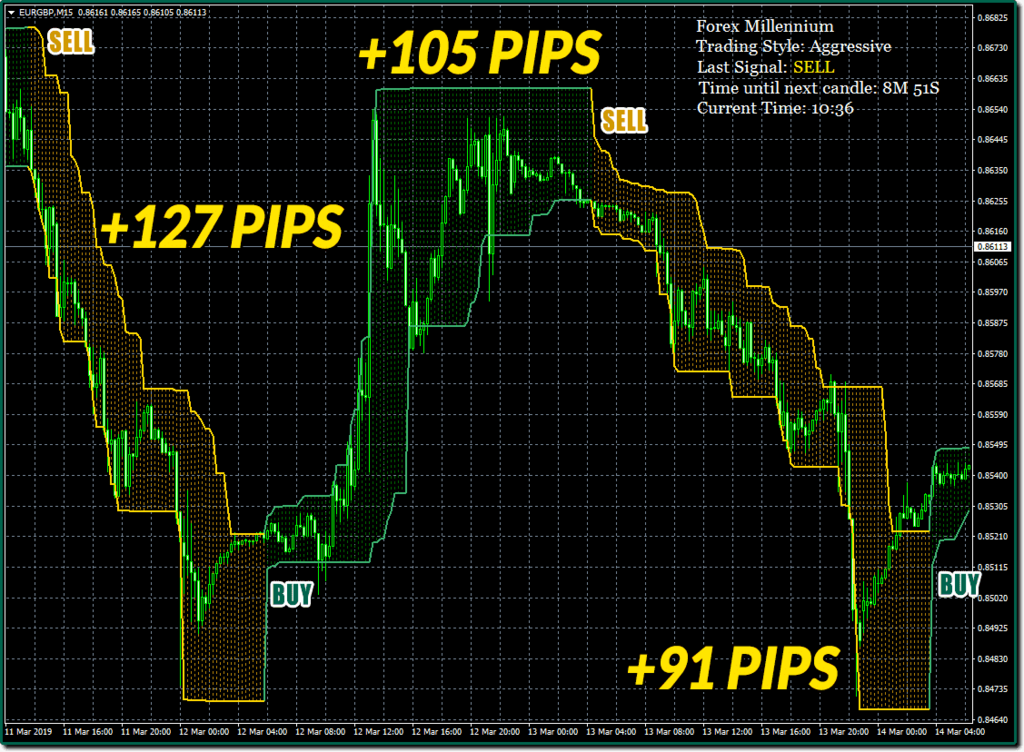
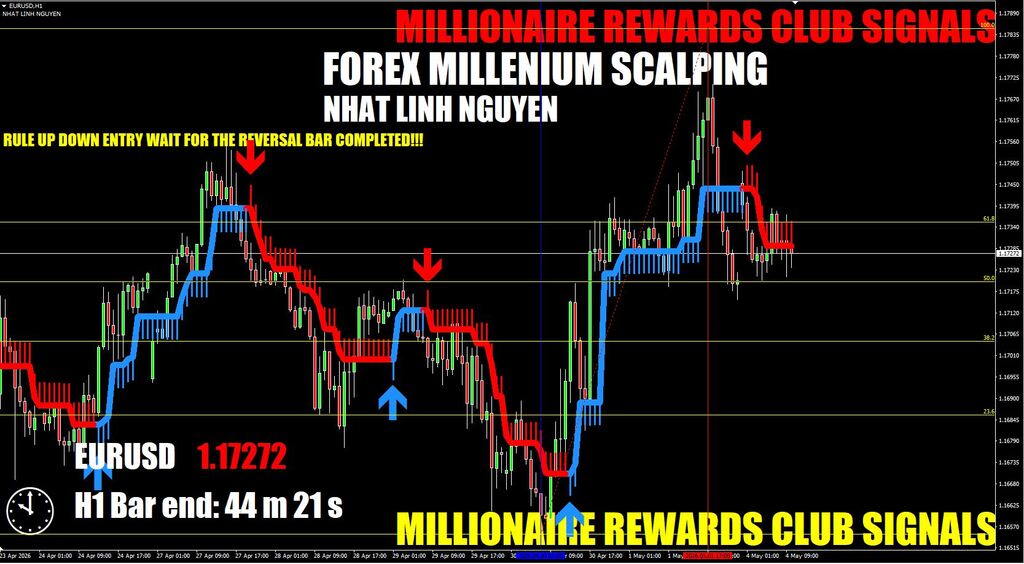
14. Forex Millennium is a new indicator for forex trading from the already known to us Karl Dittmann and his development team. The essence of their development is to give beginner traders a powerful tool for obtaining accurate signals. As always, we get an indicator with an efficient algorithm and reliable signals 100% no repaint. We only need to follow the Buy/Sell indicator signals and make a profit. Let's try to look at this miracle more closely. As you know, any new indicator is a well-forgotten old one (sometimes even the standard one from Metatrader 4). And, in my opinion, Forex Millennium is no exception. Very much in it resemblance to HalfTrend and Ozymandias. Of course, the novelty from Karl Dittmann is more perfect, devoid of repainting, significantly improved and supplemented with an information panel. In addition, it has three risk sharing modes: Conservative Mode, Medium Mode and Aggressive Mode.
PRICE $1,000
PRICE $1,000
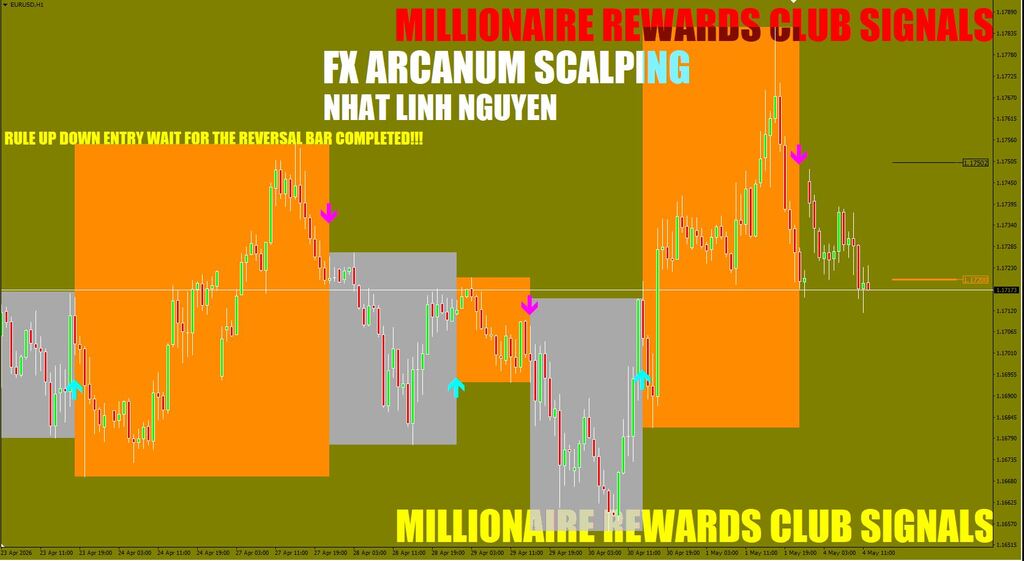
15. Forex Arcanum is a unique indicator that combines technical analysis and analysis of the behavior of traders in the market (unless of course the developers are cunning). The indicator studies the global behavior of traders in combination with the readings of some indicators, and then, based on this analysis, shows the entry point to the position on the chart. Forex Arcanum also has three modes for different trading styles and is suitable for scalping, swing trading and day trading.
FX Arcanum is, in fact, an independent trading system, which consists of two parts.
The first part is the levels of investor interest. Levels are represented on the chart as two horizontal lines:
- The thin line (1) is the short-term interest of traders. During the last few minutes or hours, investors made deals around this zone (depending on the selected timeframe).
- The thick line (2) is the long-term interest of traders. Traders have been interested in activity around this line for the last few days / hours (depending on the chosen timeframe).
The location of these lines relative to each other enables us to understand what direction is the market.
If a thin line is above a thick line - a bull market (we consider only long positions) – we open only Buy.
If the thin line under the thick line is a bear market (we consider only short positions) - we open only Sell.
The second part of the system is an algorithm that generates price blocks that show the current market phase. Buy signals are represented by up arrows. Sell signals are represented by down arrows.
PRICE $1,000
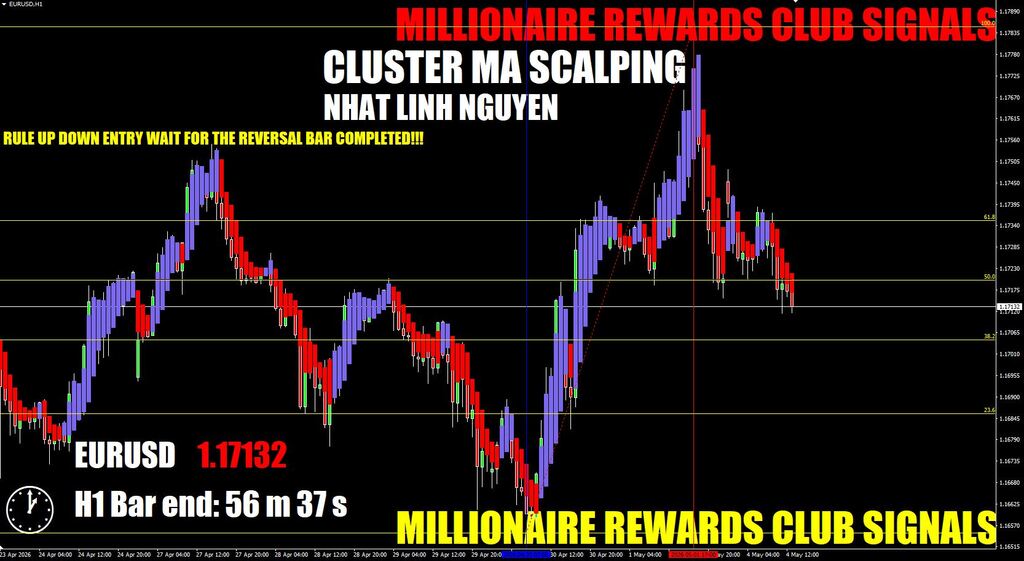
16. Scalper Cluster Moving Averages is designed to visualize the direction of the trend. This indicator is deprived of delay and therefore very effective. Scalper Cluster Moving Averages determines the direction of the current trend using a cluster digital filter. The Scalper Cluster Indicator analyzes the moving average data calculated (for prices: open, high, low, close) by the Cluster Filter indicator built on the basis of a cluster filter which is not delayed by time. Of course, Scalper Cluster MA - is, first of all, the filter indicator. But it can also be the main indicator determining the entry point to the market. Blue color - open a long position. Red color - open a short position.
PRICE $1,000
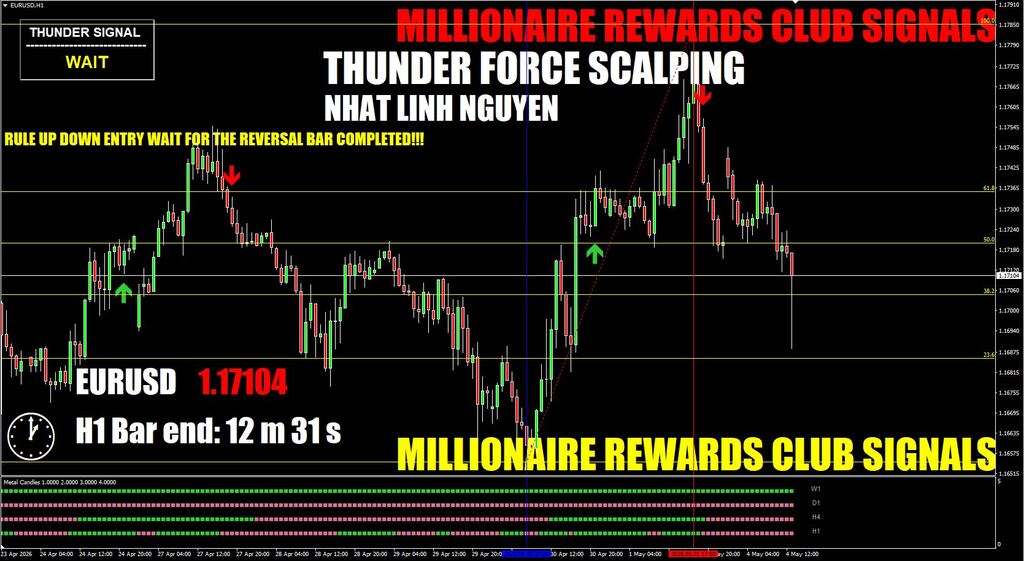
17. Thunder Force Forex System is a trend indicator trading system for MT4 with good, in my opinion, trading potential and intuitive signals. It is intended mainly for short and medium-term trading conditions. The system has not badly balanced signals by opening time and, therefore, will suit both beginners and experienced traders.
PRICE $1,000
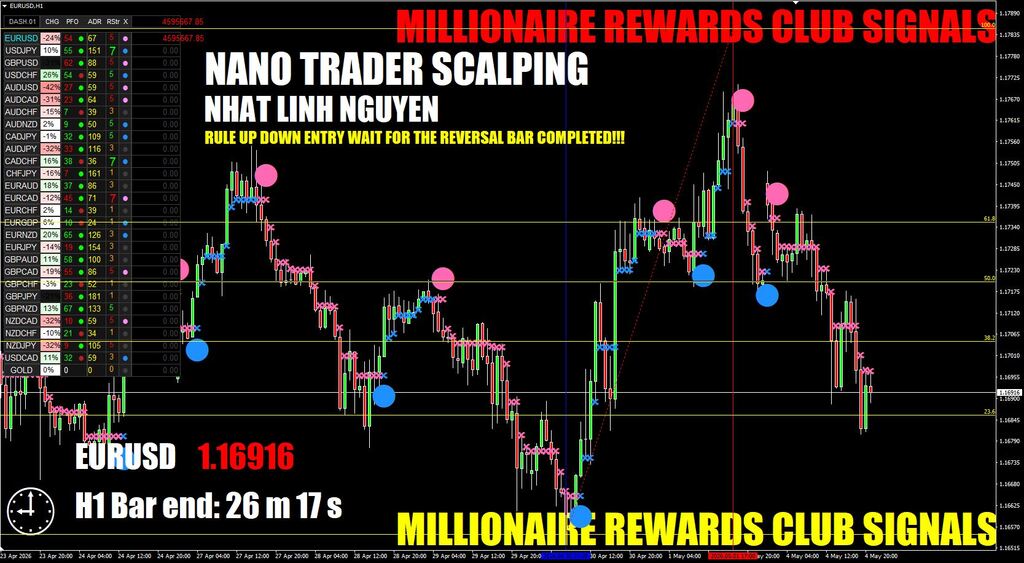
18. Nano Trader FX is a universal trading system that is perfect for scalping on M1-M5, as well as for day trading on M5-M30 and for swing trading on M30-D1. As always, the developers promise us a lot of profitable trades and huge profits when using this system. But is it really so? We need to figure this out. Let's start.
Earlier, I published an article with a trading system called FX Eagle Forex System. So NanoTrader FX as two drops of water similar to it. I would say that this is an improved and slightly modified FX Eagle strategy. The similarity is obvious. There is also a signal indicator and a panel with the analysis of currency pairs. Here's a look:
It seems to me that even the signals for entering the market are the same (or very similar). In general, sometimes it seems to me that the developers are selling us the same system, they only modify it a little. But at the heart of each of them are the same standard indicators.
Nano Trader FX has two indicators:
Nano Trader Trend Analyzer - a panel with currency pairs on the left side of the chart, is the basis of the system
Nano Trader Signal - signal indicator in the form of a blue/red line on the chart
Nano Trader Trend Analyzer analyzes currency pairs in real time and shows us pairs that are dominated by a bull trend (blue dot), a bear trend (red dot) and the absence of a pronounced trend (gray dot):
If you wish, with a double click you can switch to any currency pair from the Trend Analyzer panel. No need to additionally open a new chart. It is very comfortable.
In the settings of this indicator, you can add/remove currency pairs and other assets:
Trading Rules
BUY Signal:
Trend Analyzer shows the presence of a bull trend - a blue dot
Nano Trader Signal also drew a bold blue dot on the price chart
Open a position on the next candle when the signal has finally formed (it may disappear at the moment of formation):
SELL Signal:
Trend Analyzer shows the presence of a bearish trend - a red dot
Nano Trader Signal also drew a bold red dot on the price chart
Open a trade on the next candle when the signal has finally formed (it may disappear at the moment of formation):
Stop Loss should be set slightly higher/lower than the previous local minimum / maximum, respectively.
Exit the trade (4 options): close the open trade when a blue dot - for sell or red dot - for buy appears on the chart, go for a fixed profit target*, go for at least 2:1 reward to risk ratio or exit the trade near the previous swing high level (resistance).
*About the fixed profit target: The vast majority of traders prefer to go for a fixed profit target. It’s simple and you don’t need to calculate anything.
| H1 | 50-120 pips |
| H4 | 80-200 pips |
| D1 | 125-300 pips |
You can also exit the trade when the price crosses the signal line from bottom to top - for Sell, and from top to bottom - for Buy.
And if Trend Analyzer shows a gray dot, then we are not entering to the market.
The video clearly shows that the signal may repaint at the time of formation (time 0:50 and 3:31 on the video). But the signal does not disappear when it is finally formed!
PRICE $1,000
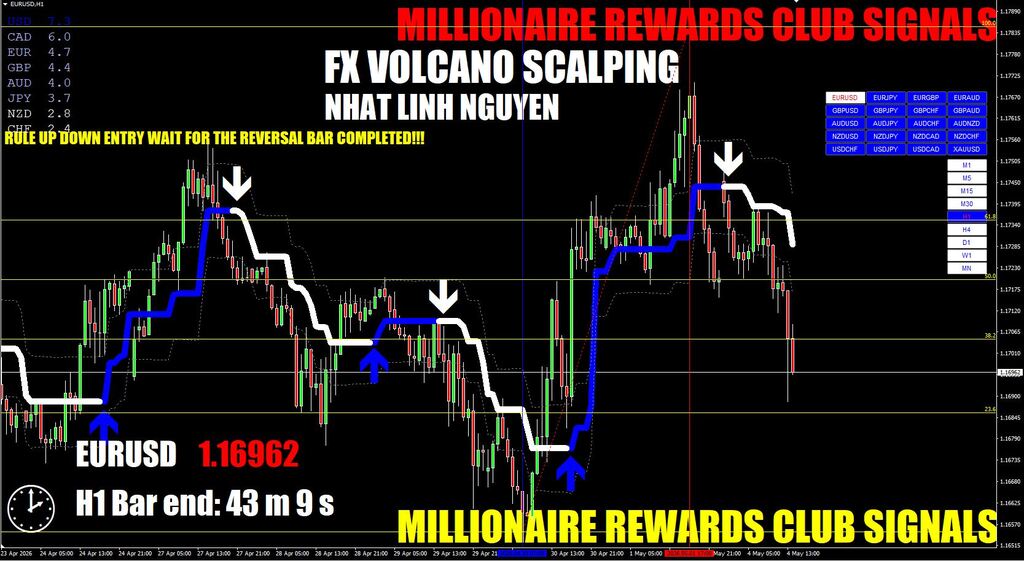
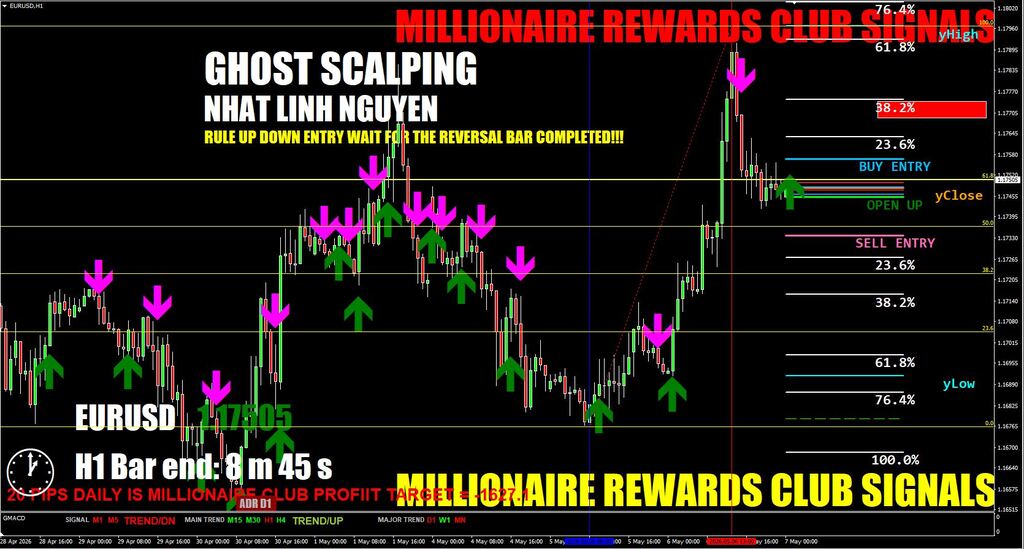
19. FX VOCANO Forex System is a trend indicator trading system for MT4 with good, in my opinion, trading potential and intuitive signals. It is intended mainly for short and medium-term trading conditions. The system has not badly balanced signals by opening time and, therefore, will suit both beginners and experienced traders. Don't change the indictors setting, leave the indicators as Default of Millionaire Rewards Club setting. Each of our signal generate 20-100 pips we just waiting for the signals show up and follow the trend direction.
PRICE $1,000
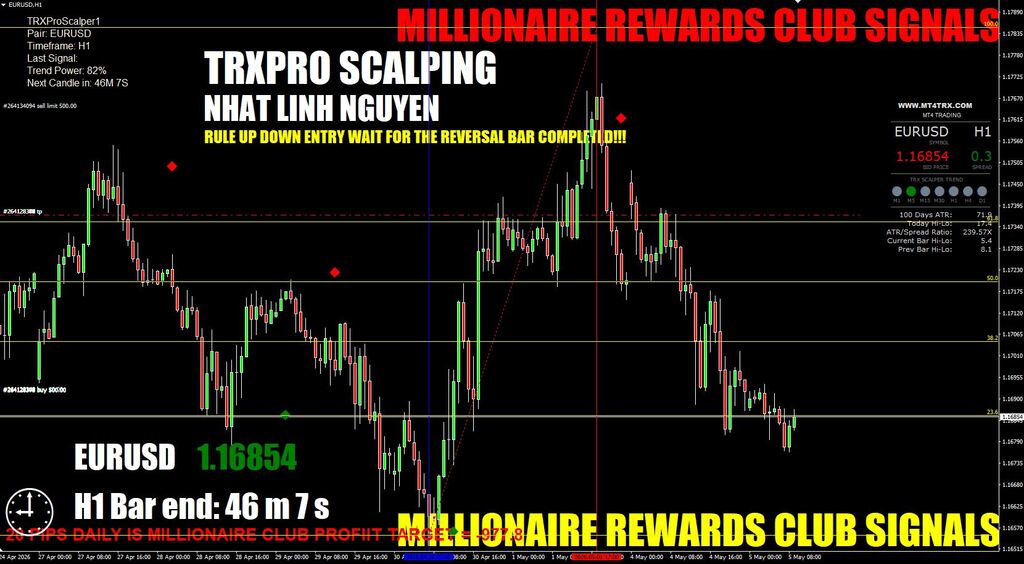
20. This time you are looking at the TRX Pro Scalping System - a creation of the irrepressible author of forex "grails" such as FX Phantom System, Star Scalper, MT4 FX Trader and many others that you can find on our site. I have already lost count of how many of them there are. In fact, there is nothing more to say here. Since this "grail" is like two drops of water similar to its sisters listed above. The same algorithm, design, templates and functionality.
Trading Rules
In fact, the system is built on the basis of one signal indicator TRXProScalper and two auxiliary-information indicators (Average Daily Range and TRXDash).
And the signal will be based mainly on TRXProScalper and TRXDash readings, namely:
BUY Signal:
Green Dot + Green Circles on higher timeframes on TRXDash:
SELL Signal:
Red Dot + Red Circles on higher timeframes on TRXDash:
StopLoss and TakeProfit can be set according to the standard scheme:
StopLoss - a few pips above/below the nearest Hight/Low.
Exit when the opposite signal appears or TakeProfit = 3*StopLoss.
PRICE $1,000
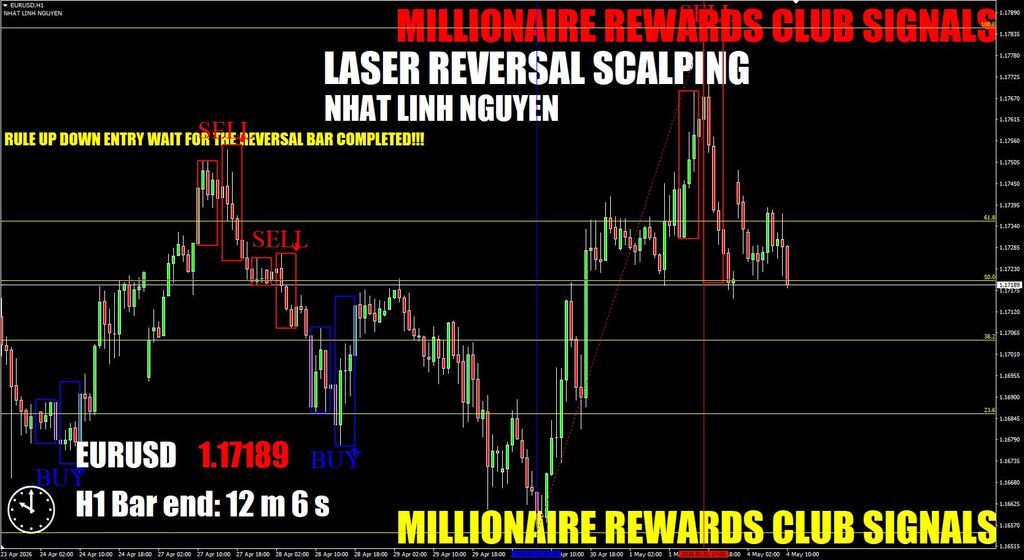
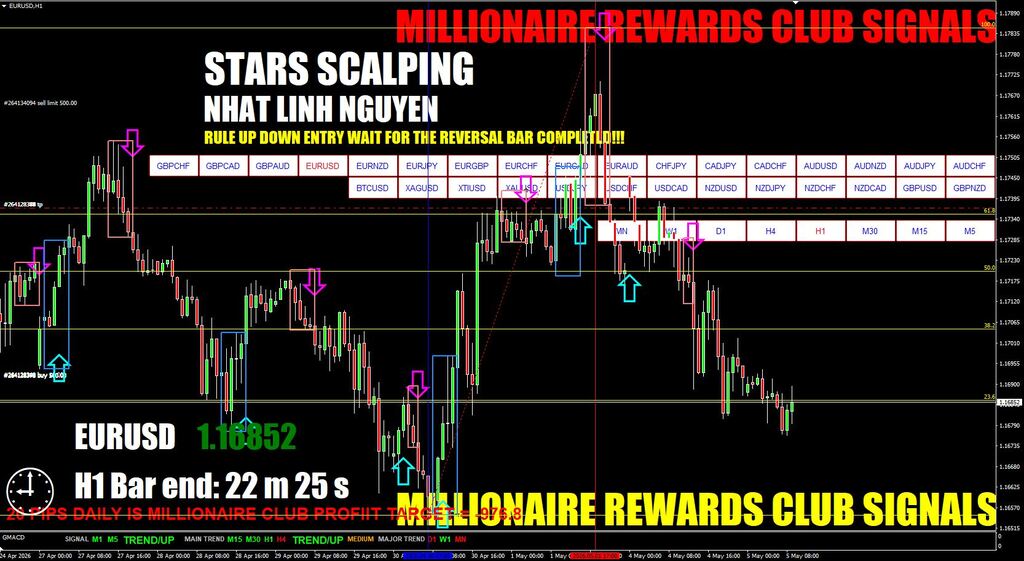
21. Star Scalper Indicators System is an easy-to-use trading system, without repainting, which has several templates for different trading styles, advanced alert system. It will suit both beginners and more experienced traders. It can be used as a standalone trading system or act as an additional confirmation tool in your trading system.
Trading Rules
Signals are very easy to read. When a new signal is printed, you will receive an alert.
NOTE: Please wait till the candle close and alert before opening a trade.
BLUE BOX - BUY SIGNAL
RED BOX - SELL SIGNAL
You can follow the signals as they appear.
Close the trade when Blue Box appears and open Buy trade.
Close the trade when Red Box appears and open Sell trade:

PRICE $1,000
22. This time you are looking at the TRX Pro Scalping System - a creation of the irrepressible author of forex "grails" such as FX Phantom System, Star Scalper, MT4 FX Trader and many others that you can find on our site. I have already lost count of how many of them there are. In fact, there is nothing more to say here. Since this "grail" is like two drops of water similar to its sisters listed above. The same algorithm, design, templates and functionality.
Trading Rules
In fact, the system is built on the basis of one signal indicator TRXProScalper and two auxiliary-information indicators (Average Daily Range and TRXDash).
And the signal will be based mainly on TRXProScalper and TRXDash readings, namely:
BUY Signal:
Green Dot + Green Circles on higher timeframes on TRXDash:
StopLoss and TakeProfit can be set according to the standard scheme:
StopLoss - a few pips above/below the nearest Hight/Low.
SELL Signal:
Red Dot + Red Circles on higher timeframes on TRXDash:
Exit when the opposite signal appears or TakeProfit = 3*StopLoss.
PRICE $1,000
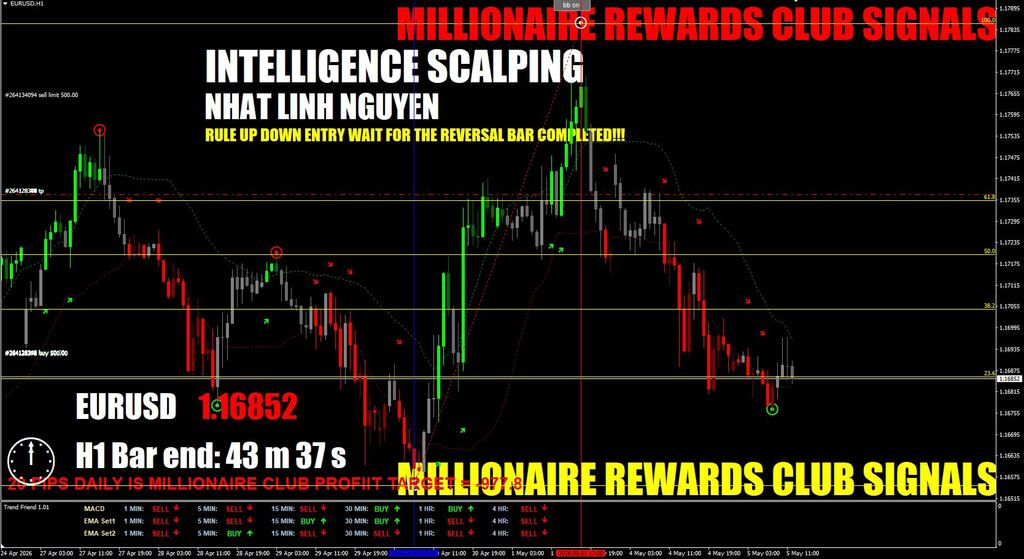
23. The Intelligent Trend Indicator is a trading system based on the signal indicator of the same name and auxiliary trend filters of higher timeframes. The seller claims that the system has a win rate of 65% and has no signal repainting.
PRICE $1,000
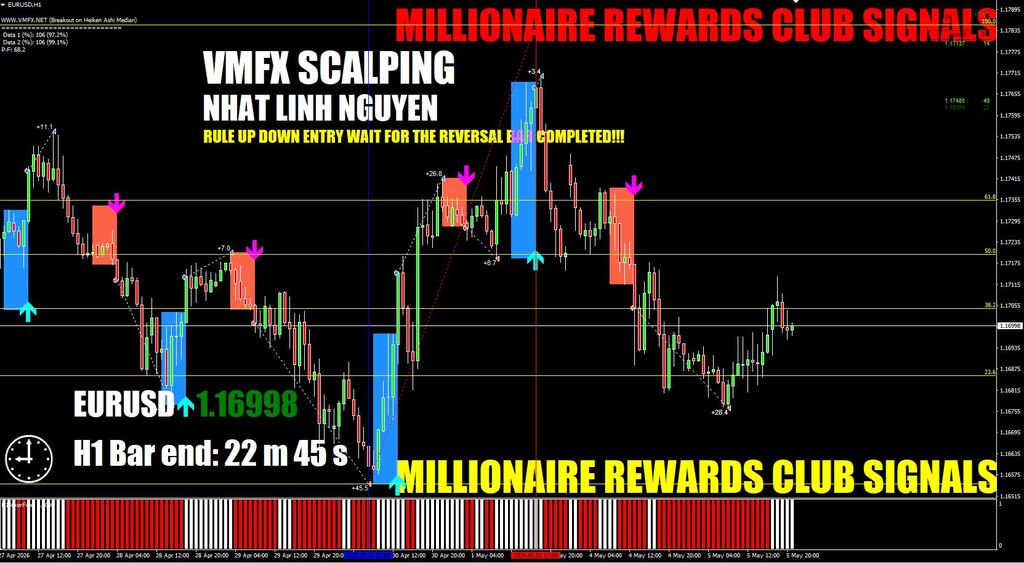
24. VMFX ELITE Trading System is an all-in-one forex system that suits different trading styles and conditions (scalping, day trading, swing trading), intuitive and easy to use. It has various templates adapted to different trading styles and market conditions. Does not repaint.
Entry/Exit Indicator (blue/red boxes).
Additional Trend Filter (bottom of the chart):
BUY Signal
Entries are very easy to spot. Blue boxes should be paired with the blue bottom trend indicator. When both indicators are in agreement BUY signals are fully confirmed.
BLUE BOX + BLUE BOTTOM = BUY SIGNAL
Sell signals are pretty much the same, we have just different colors to match. Every red box paired with the red trend bottom indicator is a valid sell signal.
SELL Signal
RED BOX + RED BOTTOM = SELL SIGNAL
Stop Loss order should be placed below (Buy signal) or above (Sell signal) the entry box.
Take Profit can be realized at RR=1:1 (TP1) or RR=1:2 (TP2):
PRICE $1,000
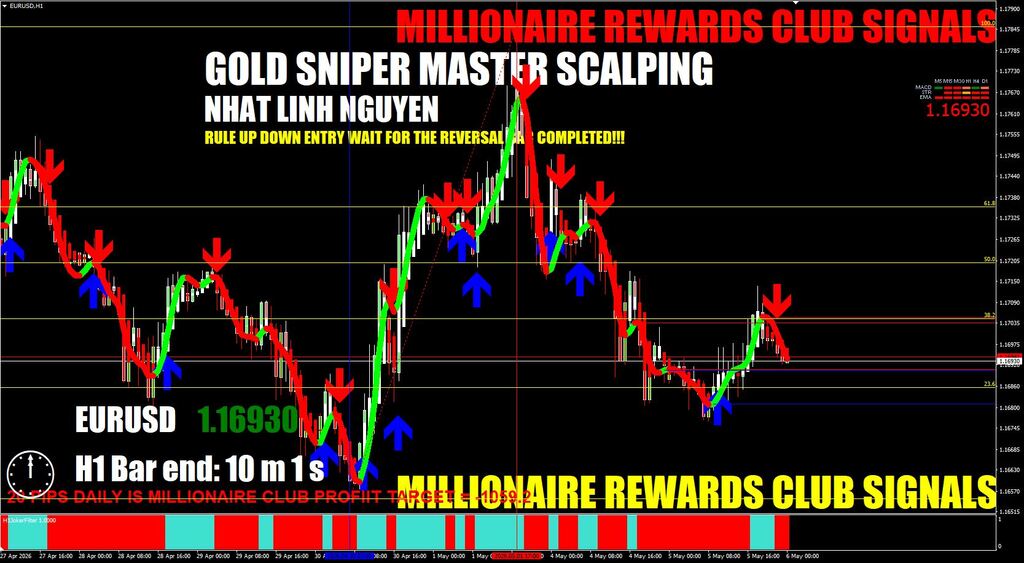
25. Gold Sniper Master Indicator - this MT4 system is designed mainly for trading on Gold, but, as my experience shows, it can be used on other assets and currency pairs. What is especially pleasing is that the main signals of this strategy are not repainted or late. In addition, the algorithm of signal formation is very correct and rational - trading is conducted from Overbought/Oversold zones in the direction of the main trend in the period of its highest volatility (London and New York sessions).
Trading Rules
First of all, you need to internalize three simple rules:
1. Trading time - European (blue zone) and American (yellow zone) sessions. You should not trade at other times:
2. Make deals only from the Oversold Zone for Buy and Overbought Zone for Sell:
3. Open a trade only when:
- Blue Arrow and Blue Dot - BUY
- Purple Arrow and Yellow Point - SELL:
As I mentioned above, the Gold Sniper Master System is not only great for trading Gold and US30, NASDAQ. It also works well on other currencies and timeframes if all the rules are followed. The proof of this can be this video, in which I made trades on AUDNZD pair and H1 timeframe. Trading was conducted on historical data using strategy tester:
PRICE $1,000
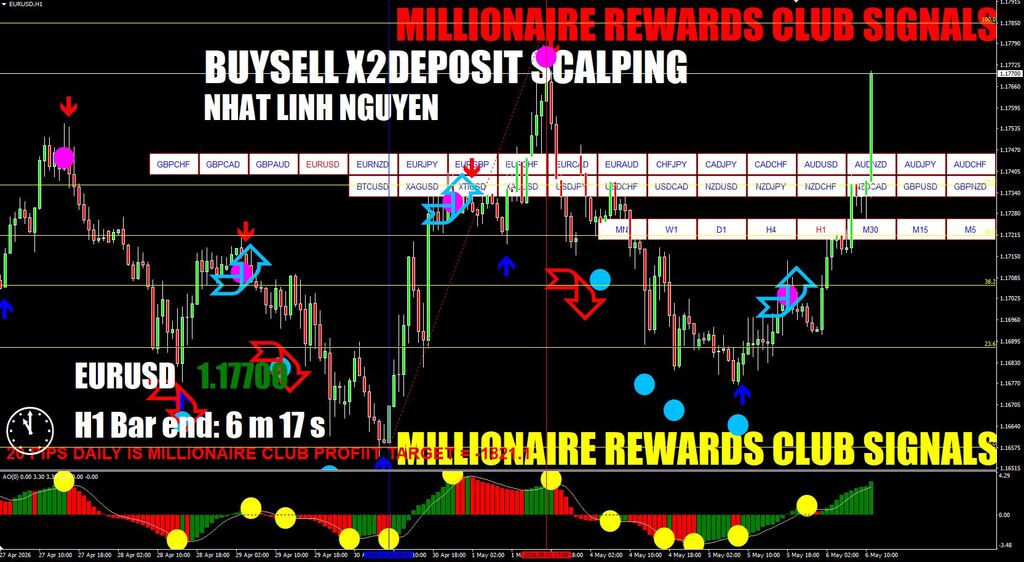
26. BUYSELL X2DEPOSIT SCALPING strategy is based on the main indicator of Buy-Sell_Alerts, which indicates the direction of price movement by the arrows. Entrances to the positions carried out when a corresponding arrow and need go out with the appearance opposite direction arrow. All very simple and effective.
Trading Rules:
Open a short position when a red down arrow. Exit when a green reverse arrow.
Open a long position when a green up arrow. Exit when a red reverse arrow.
PRICE $1,000
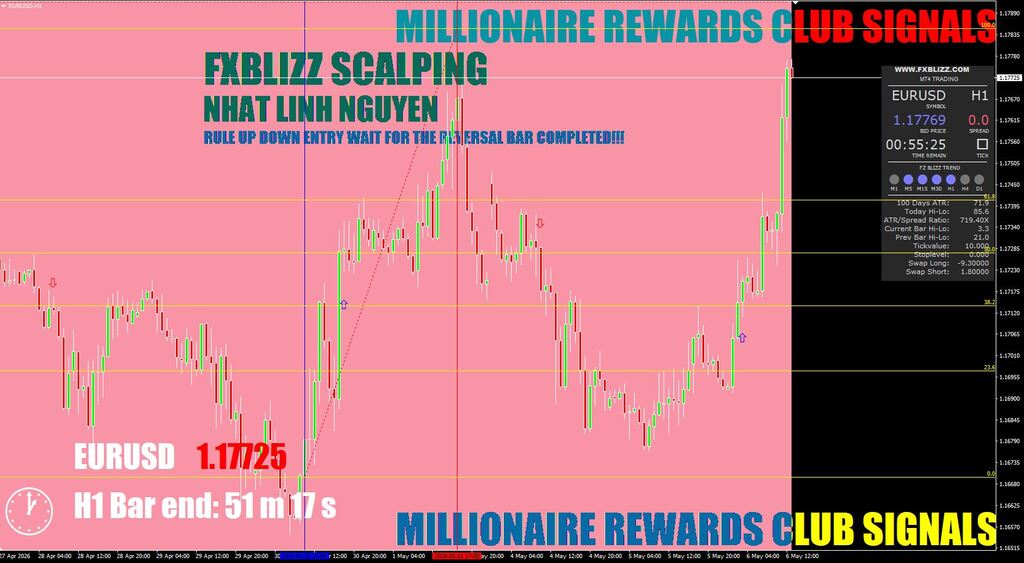
27. FXBLIZZ SCALPING
Entry Examples System provides very easy to read signals.
Buy Signal: Blue Arrow + Blue Background
Sell Signal: Red Arrow + Red Background
For even greater signal accuracy, I would personally recommend paying additional attention to the general current trend (FX BLIZZ TREND), which can be tracked on the Info Dashboard. And it is desirable that it coincides with the direction of the current signal.
No trade: Blue Arrow + Red Background
No trade: Red Arrow + Blue Background
When close a trade?
You can use oppossite signal. Or use simple RR ratios. After placing SL below/above the last swing. Aim for the same amount of pips (TP1), or double amount (TP2).
If you SL = 15 pips. TP1 should be placed at +15 pips, and TP2 at +30 pips.
Stop Loss order should be placed in the technically best place: - the last swing high (for the SELL trade) - last swing low (for the BUY trade) - at the round number - close to important support/resistance area.
PRICE $1,000
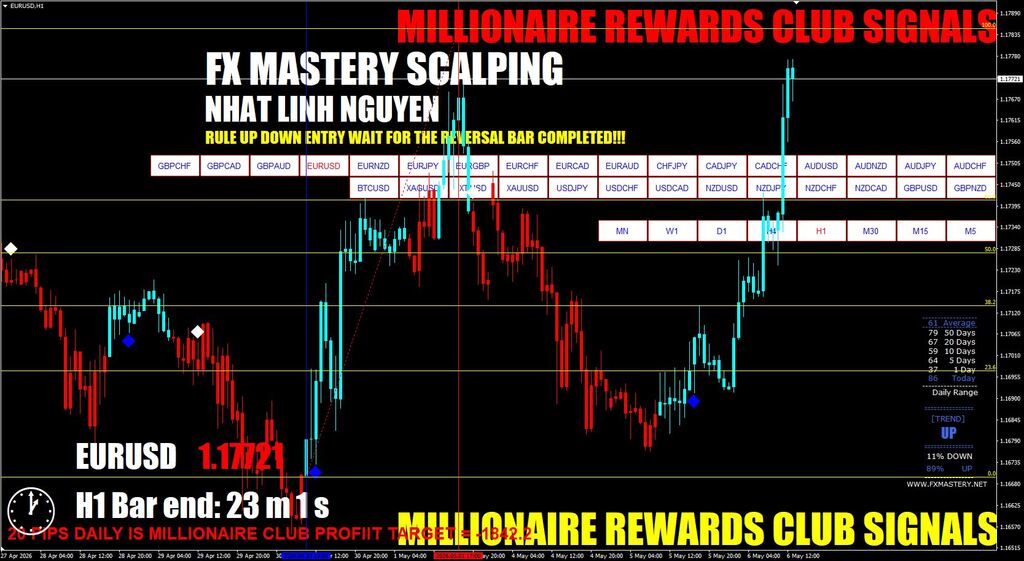
28. FX Mastery is a versatile trading system suitable for any style of trading and for any level of experience of a trader, whether you are a beginner or an experienced financial market shark. Of course, the system does not repaint and has the necessary set of alert systems so that you do not miss another profitable signal.
Trading Rules
So, directly about the signals of the system.
Buy signal:
A blue diamond appeared on the chart;
Trend Filter confirms the uptrend
Well, if the Daily Range Today is less than the average by several tens of pips - this indicates a stronger signal:
Sell signal:
Trend Filter confirms the downtrend
Well, if the Daily Range Today is less than the average by several tens of pips - this indicates a stronger signal:
Take Profit depends on the traded pair and timeframe. You can also close a deal when:
- the appearance of the opposite signal,
- at the nearest support/resistance level,
- round numbers, etc.
Stop Loss - a few pips above/below the nearest local price high/low, as shown in the screenshots above.
PRICE $1,000
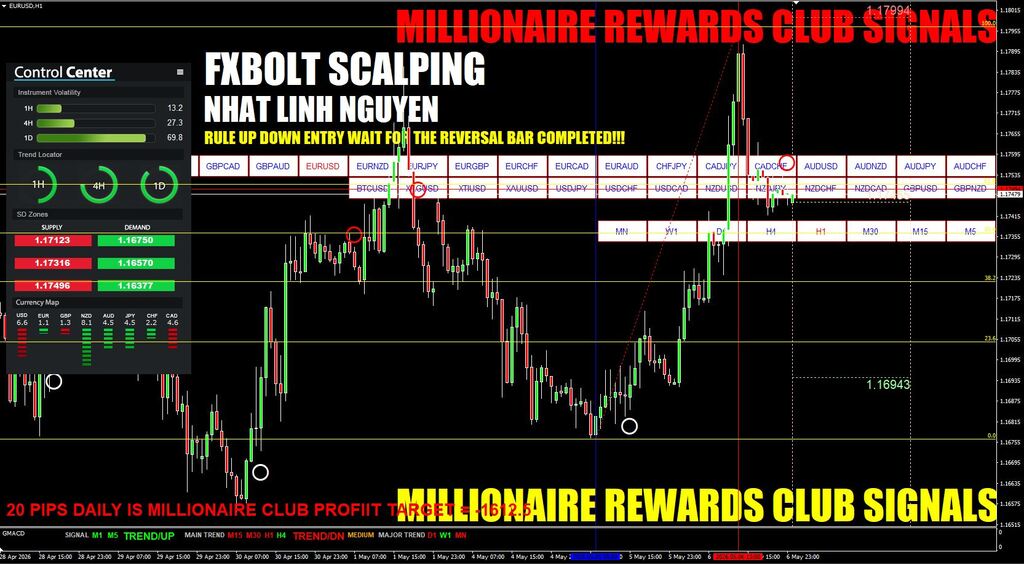
29. FX Bolt is a classic trading system based on a signal indicator, a filter indicator and support-resistance levels. In addition, the system is 100% non-repaint and is provided with an advanced notification system both by e-mail and by phone. Intuitive and easy to use. Suitable for any style of trading (scalping, day trading and swing trading). In a word, it is the dream of every trader.
Entry indicator
Filter
Support / Resistance levels
All these parts work together as one. This is how the highest signal accuracy and filtering out false signals are achieved.
BUY Signal
Main signal:
Entry dot is green
MTF Confirmation – the three main timeframes are green
When buy signal pops up and it’s in line with all 3 higher TF it’s a valid BUY signal.
The same goes for SELL signal. If you will see red circle on the chart, and all 3 TFs in the the trend locator are red (1H, 4H, 1D) it’s a valid SELL signal.
Additional confirmation (contributes to a more accurate entry
Currency Strength and Weakness analysis. Provides easy visual confirmation about the main currencies. If you are looking for a trade on specific pair, you can check if the currency is strong or weak among the rest currencies. Spply/Demand levels works similar to support/resistance zones. You can use it as Take Profit and Stop Loss levels for your trades. Pair volatility gives additional information about the pair range on specific TFs. If the pair is moving dynamically green line will be longer or shorter if the pair is in range.
SELL Signal
Main signal:
Entry dot is red MTF Confirmation – three main timeframes are red
Additional confirmation (contributes to a more accurate entry):
Currency Strength and Weakness analysis.
Support/Resistance levels. For the safest trading mode, set Take Profit at the first Demand level. And Stop Loss is at the Supple level. Pair volatility gives additional information about the pair range on specific TFs. A more volatile pair is less prone to flat (protracted sideways price movement). And although the system is operational only when the main signal occurs, I still recommend that you definitely use additional confirmation. This will save you from unwanted losses.
PRICE $1,000
30. Ghost Scalper Pro is the most rational combination of profitable trading algorithms and hidden strategies that have been combined into one trading system in order to provide the trader with a truly reliable and profitable trading tool. In fact, this is a typical non-repainting buy / sell indicator with an additional info panel and Take Profit and Top Loss levels for maximum comfort.
How it work?
Despite the fact that the name of the system contains the word "Scalper", this does not mean that we will only use it for scalping. The system is universal and suitable for any trading style, such as Typical Day Trading, Aggressive Scalping or Calm Swingtrading.
Ghost Scalper System signals are very easy to read and you don't need to be a great trader to do it. See for yourself:
Buy Entry - Blue arrow shows up. It`s a valid BUY signal. You well be notified about Entry/TP and SL Livels:
Sell Entry - Red arrow shows down. It`s a valid SELL signal. You well be notified about Entry, Take Profit and Stop Loss livels:
When a price hits Take Profit or Stop Loss level, the system will look for another entry.
PRICE $1,000
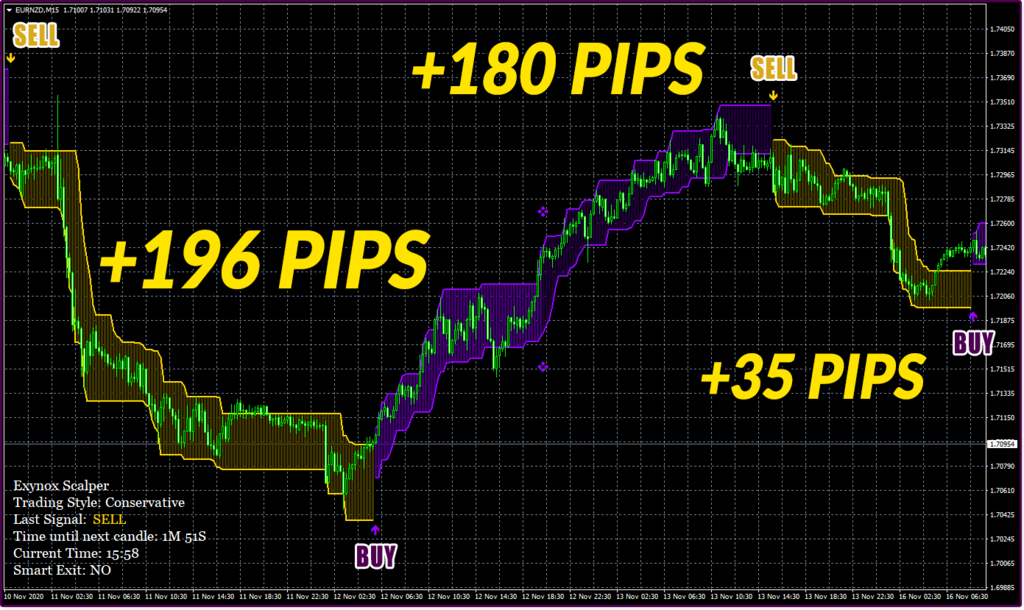
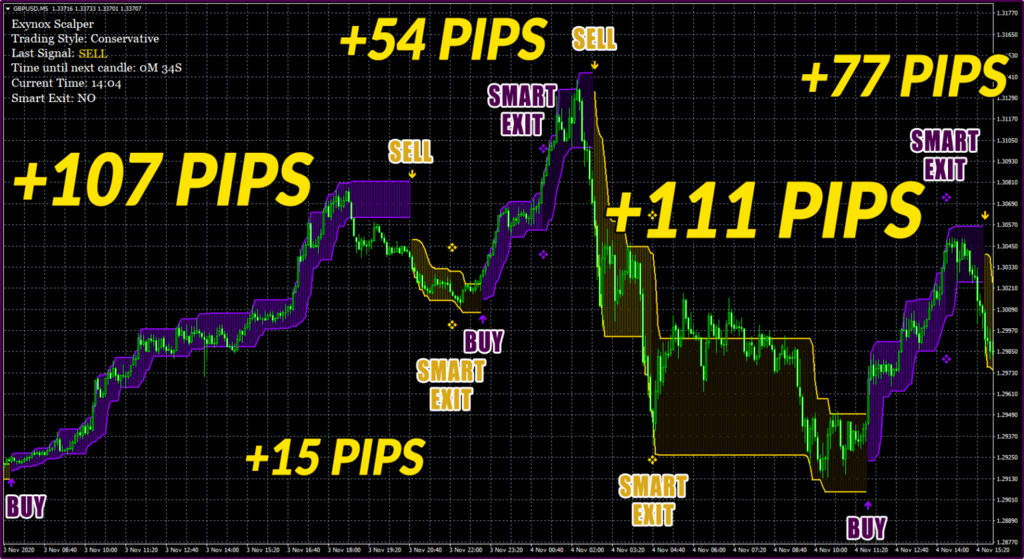
31. Exynox Scalper is another novelty of Karl Dittmann among the forex trading systems that works on all major pairs and timeframes M1-M30. According to the developer, the system is characterized by high profitability and ease of use, equipped with an understandable and timely notification system. And, of course, it is devoid of any repainting and lag.
However, it is better to see the indicator in action once than to read a lot of words about its advantages. Video in which the indicator makes +812 pips to the total profit (6 consecutive wins):
For conservative traders, the indicator provides the Smart Exit technology, which suggests when the trend is coming to an end, it is better to close the deal:
But no matter how profitable and accurate Exynox Scalper turns out to be, do not forget to use a demo account first and be sure to follow Money Management.
PRICE $1,000
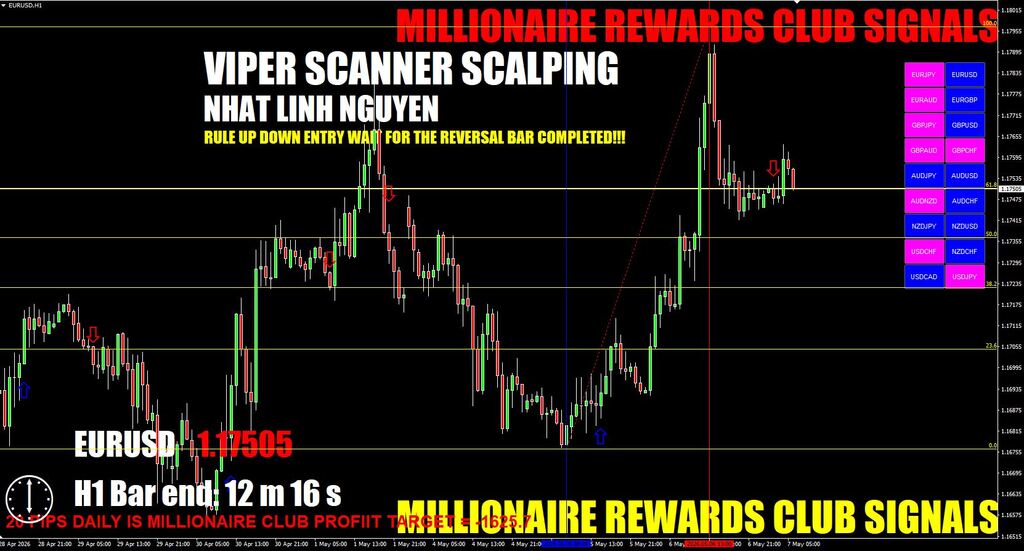
32. Viper Scanner is a trading system that has accurate trading signals. It can be used in trading any asset and on any Time Frame. It is not difficult to use, so it is suitable even for novice traders. 100% non-repaint.
How does it work?
BUY Example
You can change the pairs using market scanner. Just click on the pair and your chart will transform to the one you have chosen. On this example we will switch to NZDUSD (BLUE color on the scanner). Now, we need to wait for the signal that is in line with that color (UP Signal – BLUE arrow):
When a BLUE arrow is produced it’s a valid BUY signal.
You can also use your own exit technique, like support/resistance levels, round numbers, or different exit custom indicators.
SELL Example
Let’s check how SELL signals work. Switch to EURAUD that is RED on the scanner.
Now, we need to wait for down (red) arrow to show up:
When such arrow appears it’s a valid SELL signal.
Close the trade on the opposite signal:
PRICE $1,000
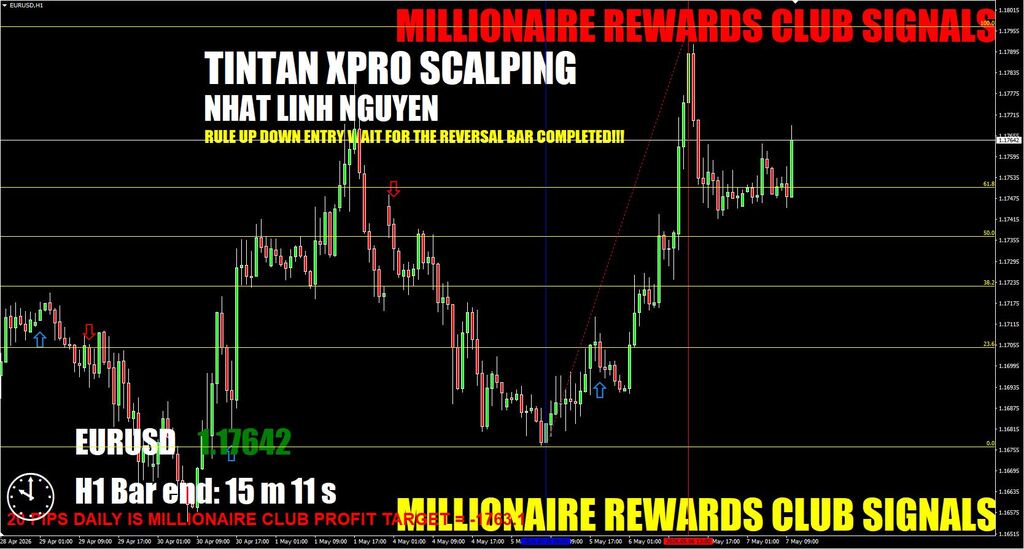
33. Titan XPRO is another remake of the Forex Profit Supreme System we have known for a long time. Moreover, it is available on our site with the mql4 source code. Thus, anyone with basic knowledge of MQL can alter it for themselves and their needs. This happened with the Titan X PRO. The author did not even bother to change the appearance of the indicator, but he did not hesitate to charge for it. Well, that's his right. Nevertheless, this system is absolutely free on our website, download at the bottom of this post.
Trading rules
On the dashboard, we find which currencies are bought and sold by the largest market players. Based on this, we select the currency pair. Wait for the next signal generated by the TitanXpro_Entry indicator (you will receive a notification) and open a trade in the direction indicated by the arrow.
In this way, you join the market trend created by the largest traders.
BUY Signal:
SELL Signal:
Stop Loss - slightly above/below the local price maximum/minimum.
Take Profit - based on the trading style, but not less than 2 * StopLoss.
PRICE $1,000
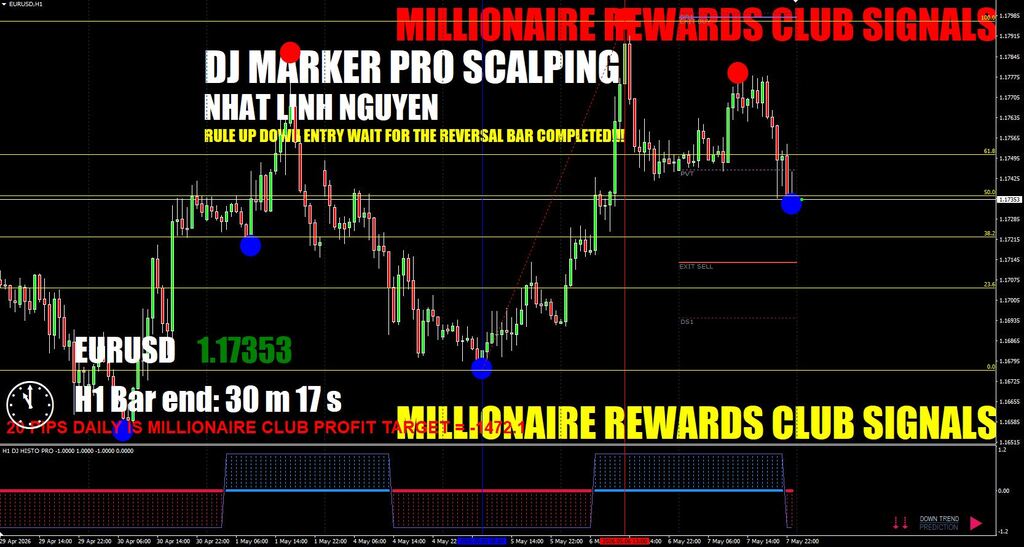
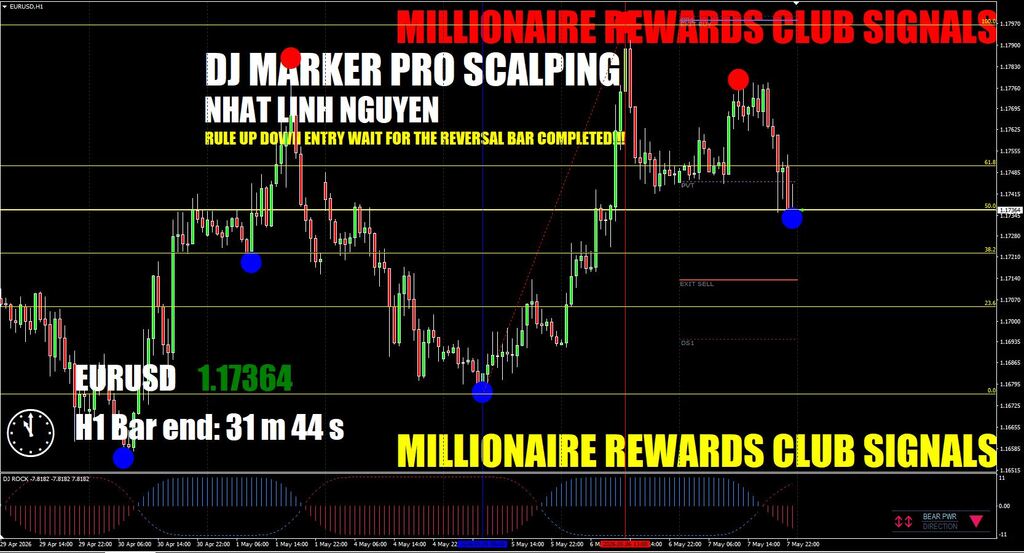
34. Forex DJ Market Pro is a trading system that can analyze market movements technically with accuracy. This system is simple and easy to use and understand, if used property, it can increase your trading success rate and maximum profit.
1. DJPVT
Pivot Point Explanation
The Pivot Points indicator is a simple pivot indicator that will provide basic information such as Daily Pivot Points, Support 1, Support 2, Support 3, Resistance 1, Resistance 2, and Resistance 3:
1. Simple Entry
This entry only uses signals from DJ X6 or arrows. The advantage of simple entry can easily get a reversal signal if the trend is trending or does not have a sideway
ENTRY BUY when an arrow appears UP
ENTRY SELL when an arrow appears DOWN
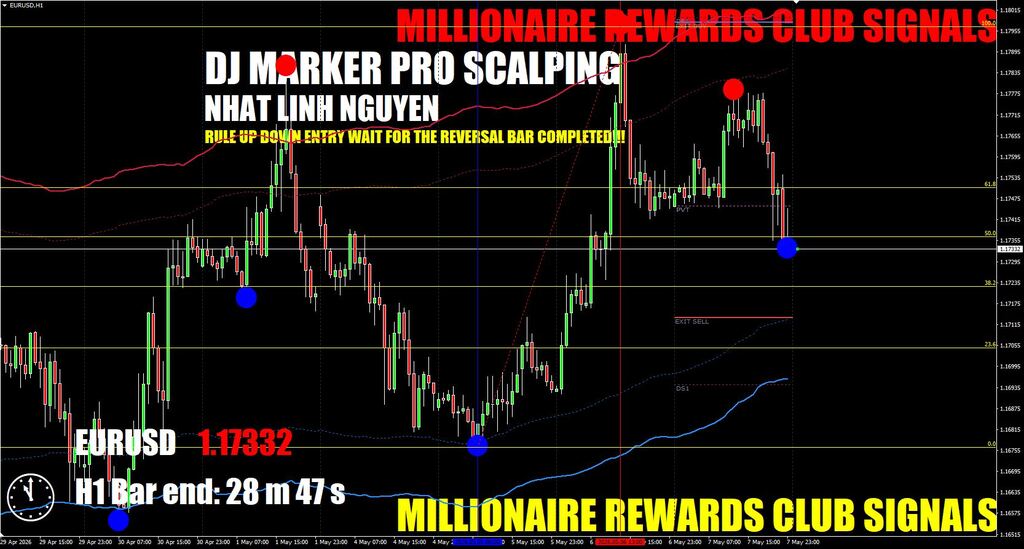
2. Safe Entry
This method is safer for ENTRY, but requires confirmation from some indicators
ENTRY SELL
Arrows appear DOWN
DJ ROCK color histogram RED
The seller is bigger than the buyer
Moving average trend M30, H1, H4 color RED
ENTRY BUY
Arrows appear UP
DJ ROCK color histogram BLUE
The buyer is bigger than the seller
Moving average trend M30, H1, H4 color BLUE
DJ Market Pro will provide automatic signals and alerts to the user complete with Stop Loss and Take Profit so that users only forward the recommended signal and alerts to manually open positions:
PRICE $1,000
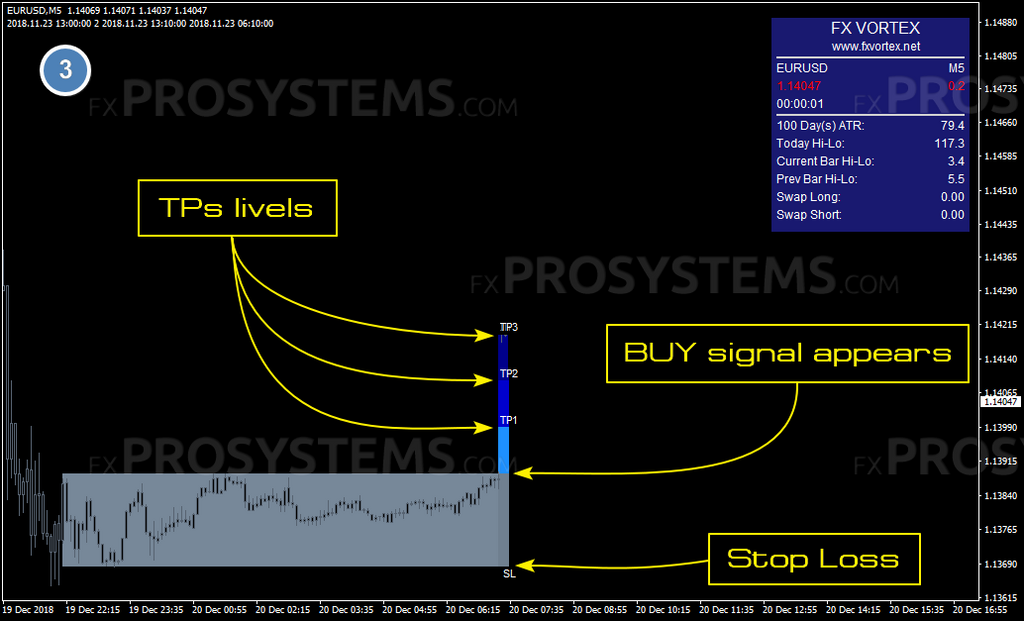
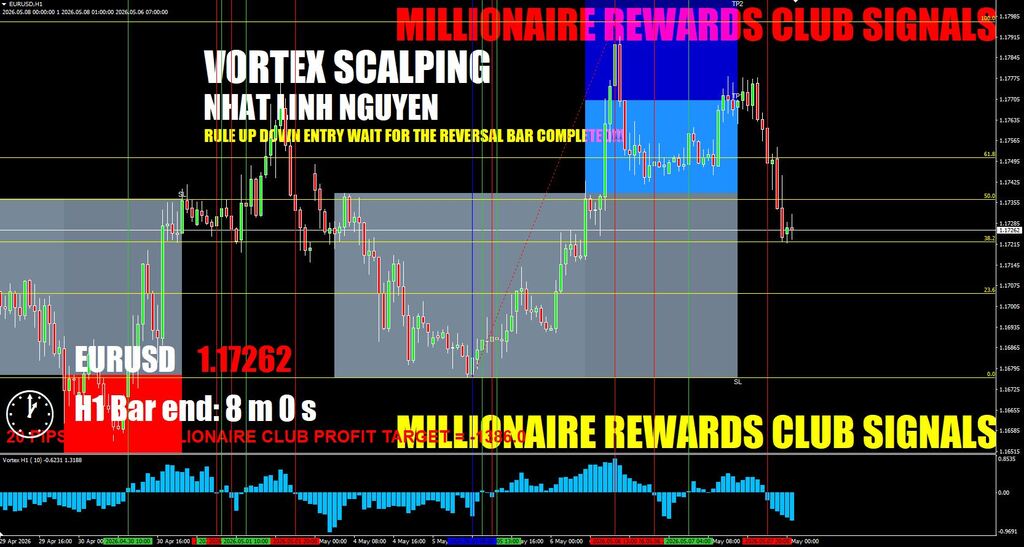
35. FX Vortex 2.0 (or Vortex Sniper 2.0) is a combination of several analytical algorithms that together are capable of generating accurate buy / sell signals. The signals are intuitive and will not be difficult even for novice traders. The system can be used on any timeframe with major currency pairs. And of course no repainting - Vortex 2.0 100% non-repaint.
You can choose the template that suits you best. And now you are ready to trade.
The signal appears as a gray rectangle when all the conditions of the system's trading algorithms are met.
BUY trade
Price still in the narrow range. Waiting for signal:
When the price breaks the upper border of the gray channel, a BUY signal appears and the recommended Stop Loss levels and three Take Profit levels (TP1, TP2 and TP3):
The trade should remain open until it hits take profit. As we can see on the below example it went much higher than the TP3 level:
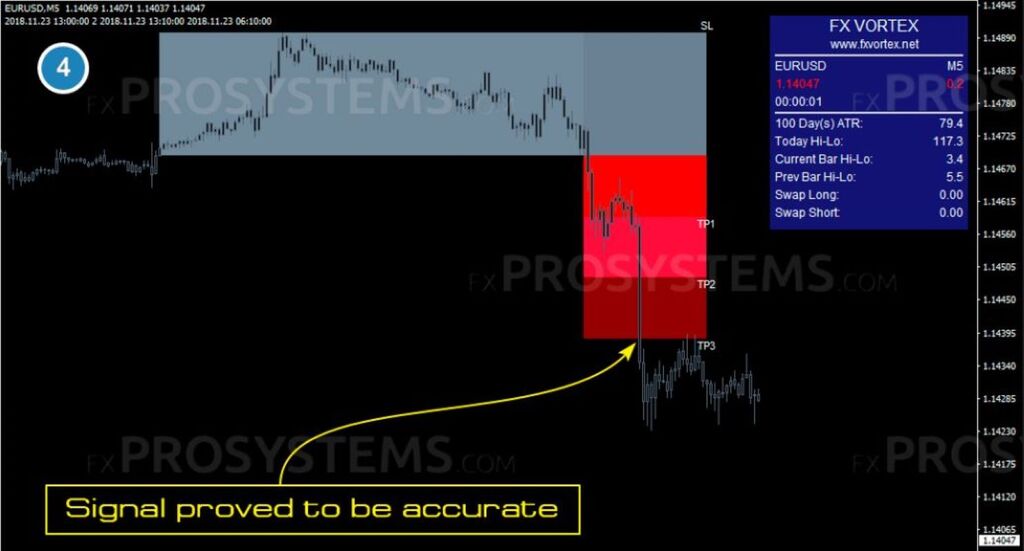
SELL trade
A sell signal is generated in the same way as a buy signal.
We are waiting for the signal to appear:
When the price crosses the lower border of the gray rectangle, a sell signal appears. The red zones will show us the Take Profit levels. Stop Loss at the upper border of the gray rectangle:
As we can see in the example below, the price dropped much below the TP3 level:
Why three Take Profits? Here is what the author of this system answers to this:
PRICE $1,000
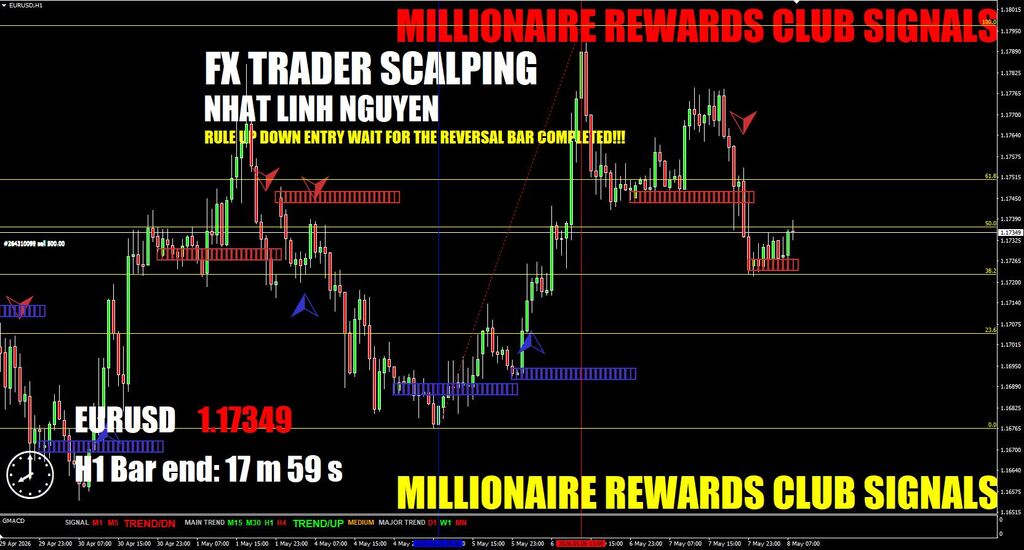
36. MT4 FX Trader is a trend trading system already traditionally based on the main Buy/Sell indicator, whose signals are supported by an additional filter indicator and Trading dashboard. Three trading templates for different trading styles and no repainting of signals. That's short, now more.
How does it work
Entry Examples
Entry signals are very simple and can be visualized as follows:
BUY TRADE / SELL TRADE
Recommend to start with M15 TF to see how it works. Later you can switch to fastest M5 or M1.
Software provides easy signals. When we see the blue bias indicator, we take BUY signals only.
The same goes for sell signals, when we see the red bias indicator, we take SELL signals only.
Sometimes when there is a sudden market change, or the price simply does not 'respect' our calculated bias, it can change during the day.
On the below example we can see that the day started 'red' while it turned into 'blue' later. Please don't worry, as bias indicator does not repaint or redraw. If it's calculations are 'wrong' for any particular day (as none of the indicators are always right), it will just change it's color, so you can still try to make pips this day.
Stop loss order should be placed in the technically best place:
The last swing high (for the SELL trade)
Last swing low (for the BUY trade)
At the round number
Close to important support/resistance area
Of course, a modern trading system is inconceivable without an advanced alert system, so MT4 FX Trader is completely in order with this. You can see the Alert, set up notifications for Email, mobile notification or platform pop-ups:
PRICE $1,000
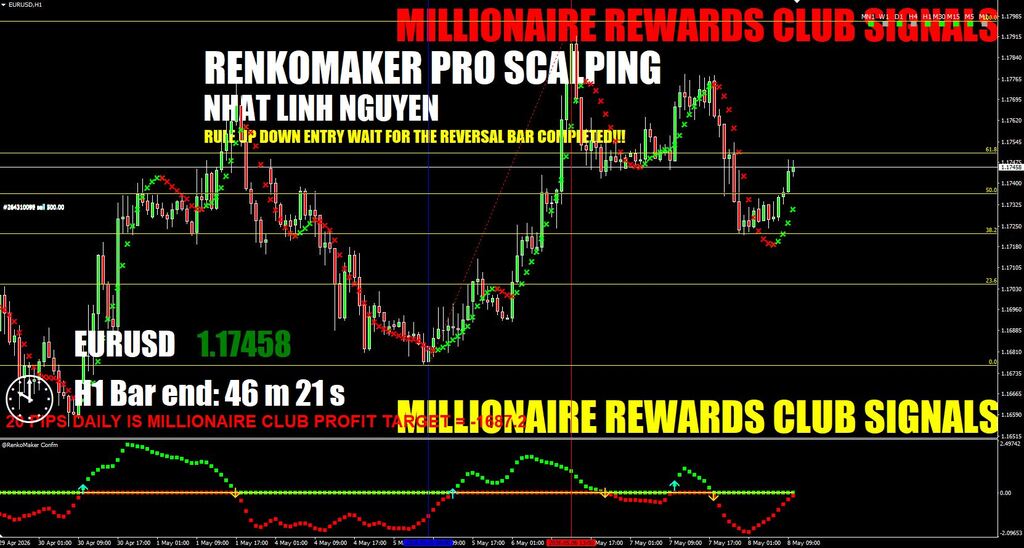
37. Renko Maker Pro Trading System up to 1500+ pips per trade.Renko Maker Pro Trading System is able to bring up to 1500+ pips (!!!) profit according to the developers. The system is designed for Renko charts and is based on only three indicators. This trading strategy is already quite old, but today it is able to make a profit on the condition of reasonable trading and when all recommendations are followed.
Trading rules
BUY - when both indicators (Signal and Confirmation) are colored green (after closing the candle)
SELL - when both indicators (Signal and Confirmation) are colored red (after closing the candle):
Take Profit (Closed) - when the first opposite color appears after closing the current candle.
Developers recommend opening deals only in the direction of the trend. This is common sense, because "Trend is your friend." And the MTF TrendBar indicator, which is located in the upper right corner, will help us understand the direction of the trend:
Green - Bull Market (trend UP)
Red - Bear Market (trend DOWN)
Gray - Flat Market (Sideway)
When determining the direction of the current trend, one should take into account the older Time Frames H1 - MN1.
Follow the direction of the trend and do not be late with the opening of the transaction when both indicators are colored the same after the close of the signal candle. The same rule is relevant when closing a deal - you also don’t need to be late, close the deal after changing the color of the Signal Indicator to the opposite color after closing the candle.
Do not enter the market with a flat market (gray squares on Trend Bar).
Be sure to practice on a demo account. And only after acquiring a confident positive trend in the growth of your account, you can proceed to real trading.
Do not forget about the important condition of any successful trader - Money Management and do not risk more than 2% of your account.
PRICE $1,000
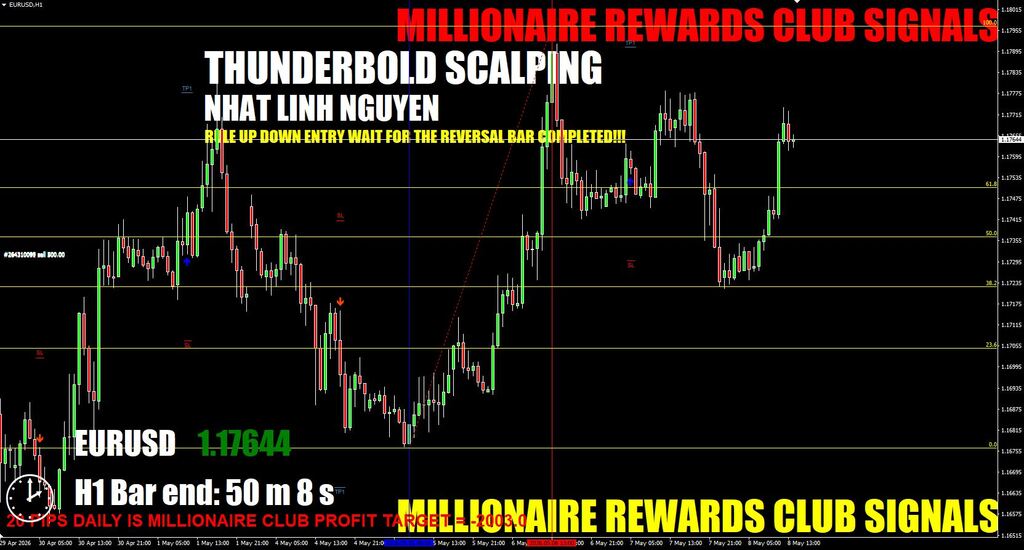
38. Forex Thunderbolt is a trading system with universal properties of trading modes, which is suitable for traders of different levels of preparation (including for beginners) and for different trading styles (scalping, day trading and swing trading). There are no strict restrictions on time frames and currency pairs. Although the developers recommend using the major currency pairs due to the low spread and good liquidity and trading in the American and European sessions.
The system is easy to trade. After the signal appears, immediately open a trade in the direction of the signal arrow. The Stop Loss and Take Profit levels are displayed on the chart by the Forex Thunderbolt Trading System.
So, BUY - when the blue up arrow appeared:
SELL - when the red down arrow appeared:
Before using Forex Thunderbolt on a real account, first practice on a demo account to better understand the signals and principles of the system.
Do not try to enter a trade if you missed a signal and the price has significantly gone from the entry level. It is better to wait for the next signal and enter the deal in a timely manner.
PRICE $1,000
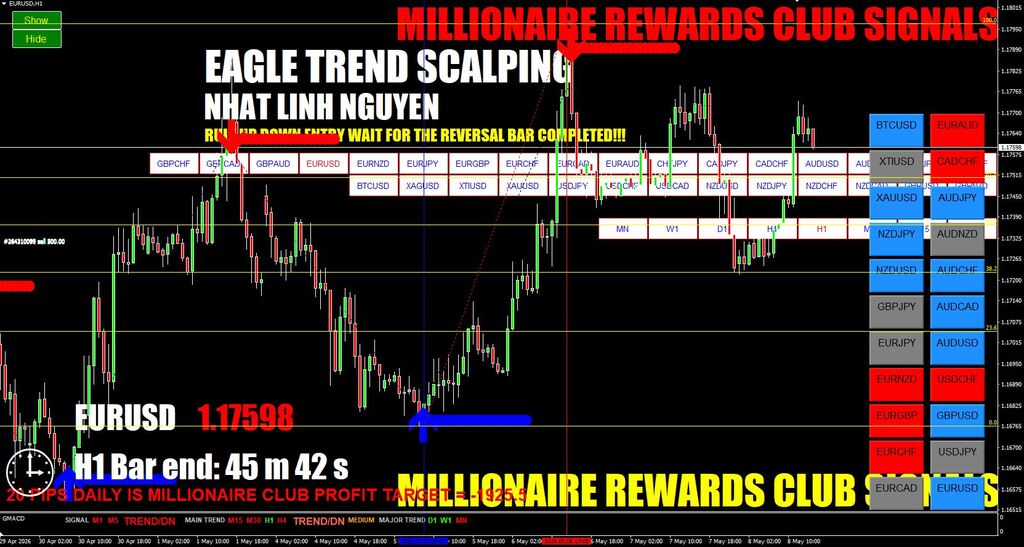
39. FX Eagle Forex System 2.0 is a classic Forex trading system that consists of two indicators: a signal indicator (FX Eagle Signal Indicator) and a filter (FX Eagle Dashboard). The system is not repainted and has good performance indicators according to the developers.
FX Eagle Dashboard is a kind of advanced trend analyzer that measures the strongest trend on multiple timeframes using a secret formula. It shows rectangles with the name of the currency pair. The color of the rectangles means the following:
Red - only sell trades (ignore buy trades)
Grey (Neutral) - no trade
By the way, you can switch between charts by simply double-clicking inside the rectangle with the desired currency pair, and the chart will load instantly. It is very comfortable.
In addition, you can change/add/remove trading assets via the indicator’s inputs tab. Here you can change the colors of the rectangles, font size and enable/disable alerts (enabled by default):
BUY signal - FX Eagle Dashboard is colored BLUE and the FX Eagle Signal Arrow is colored BLUE as well.
Place a Stop Loss below the most recent low.
SELL signal - FX Eagle Dashboard is colored RED and the FX Eagle Signal Arrow is colored RED as well.
Place a Stop Loss above the most recent high.
Below you will find so typical take profit targets for the different timeframes:
Exit the trade (3 options):
Go for at least 2:1 reward to risk ratio or exit the trade near the previous swing low/high level (support).
When an opposite signal appears.
Fixed profit target. It’s simple and you don’t need to calculate anything.
Below you will find so typical take profit targets for the different timeframes:
As always, follow basic money management and do not risk whiter than 2% of your deposit in a separate transaction. Do not trade during the release of important economic news (see the economic calendar here) and be sure to test on a demo account.
PRICE $1,000
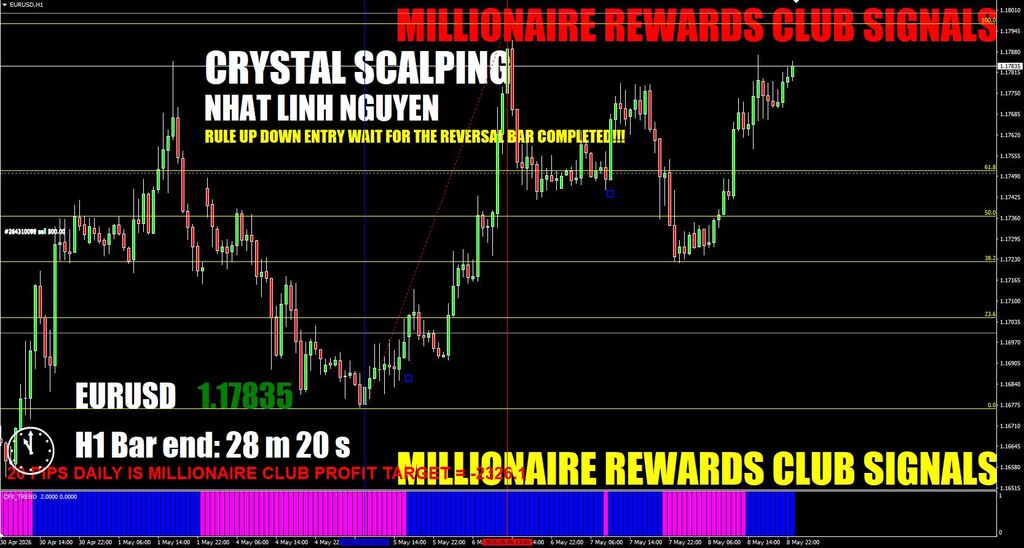
40. Crystal FX is a forex trading system that can make your trading simple and at the same time very profitable. It will replace you with many technical indicators and save you from doubts before opening a deal. Indicators of this system do not repaint. Not in real time, nor in any other conditions. Everything is simple and clear here. Cast aside doubts and trust this trading system. But ... at the same time, do not forget that this is trading and any situations are possible here. And the Grail has not yet been found.
The bottom BLUE/MAGENTA Indicator (1) is to give you a heads up what signals to expect. Entry squares will be always in line with the trend, so the only thing you need to watch is the entries (small squares on the chart):
How Does System Work?
CFX_Aggressive
Suitable for lovers of scalping and quick profit. But the maximum risk.. Recommended only for experienced traders.
System provides very easy BUY/SELL signals.
BUY Signal:
Blue square appeared
At the same time, the Trend Detector is blue (bullish trend):
Where to close the trade?
Take a look at the nearest round levels.
If the trade is moving slowly, try to close the trade on the first round level - Target 1
If the market moves fast try to aim for the second (or even third) round level - Target 2:
Black square appeared
At the same time, the Trend Detector is black (bearish trend):
On the below example we can see that the price has reached the first round level fast, but then started to consolidate. If the price stays for 15-20+ candles between the round levels it’s good to close that trade:
Stop Loss should be placed in the following places depending on the current market situation:
last local price low (for BUY)
last local price maximum (for SELL)
on the round number (if close)
close to an important support/resistance level
Try to minimalize your Stop Loss and aim for high RR ratios.
For example:
If the last swing is MUCH closer than round level, put the Stop Loss on the last swing.
The ideal trades in daytrading (M5 - M15) are when your risk 15-20 pips and aim for 40-50.
If you scalp (M1 - M5) try to risk no more than 10 and try to reach 20+ pips.
If you are swing trader (H1 - D1) the Stop Loss should be around 30-50pips, while Take Profit 100+ pips.
PRICE $1,000
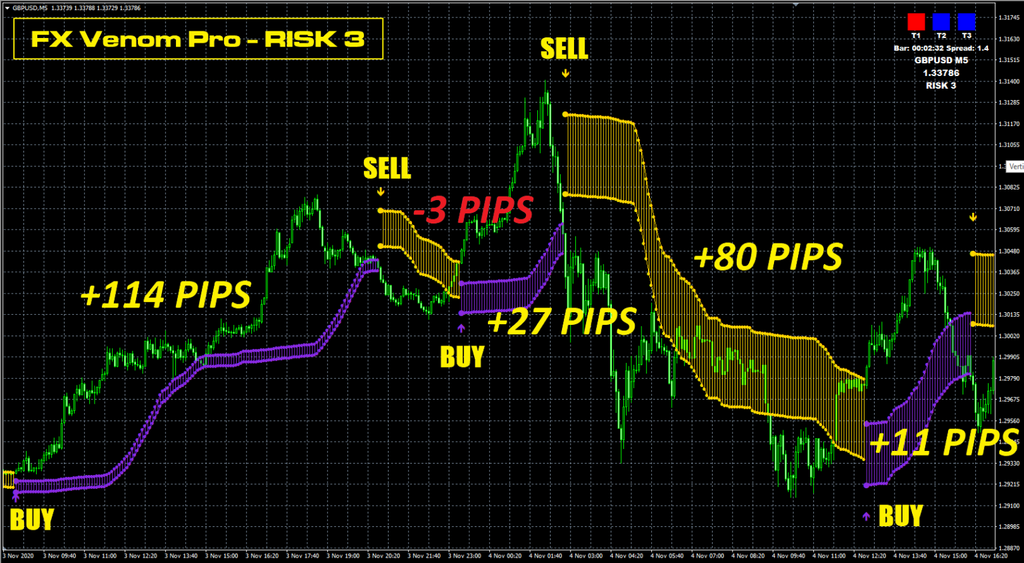
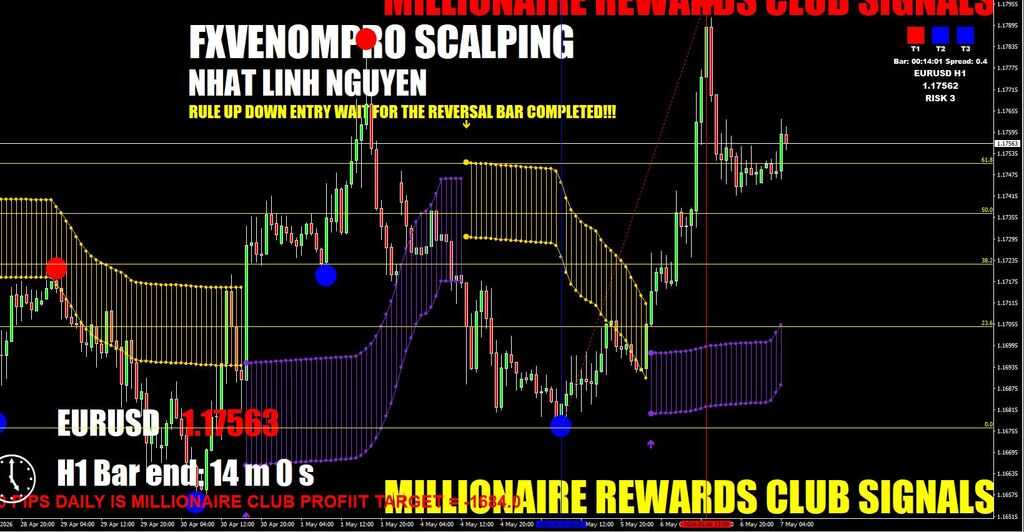
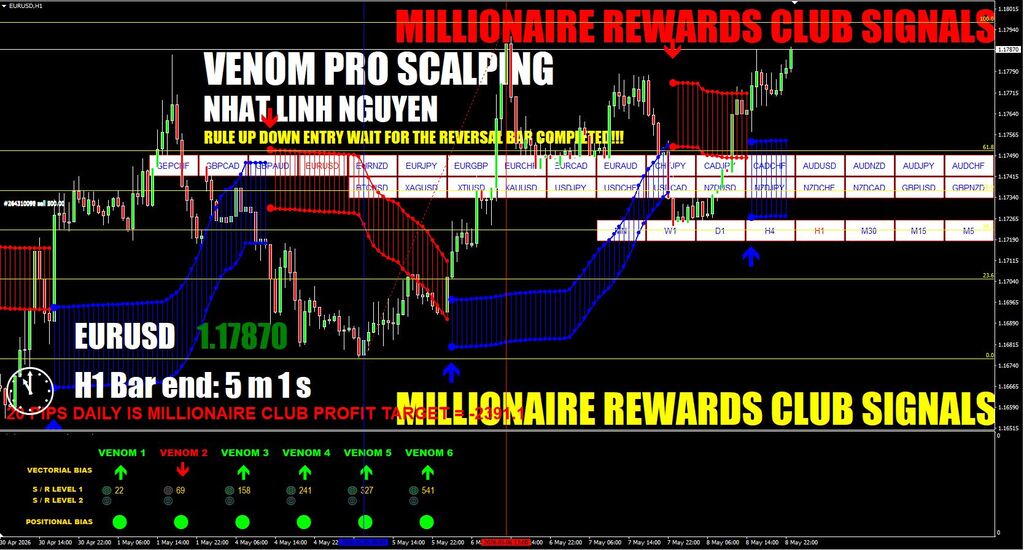
41. FX Venom Pro is a trading system designed to make all traders in the world rich. Can you imagine a 50-120 pips of profit every day? We Now in detail about the FX Venom Pro.
The system is made in the classic version - it is a signal indicator (red/blue arrows and bands), an additional filter in the form of an information dashboard located in the upper right corner. It is this combination of indicators is often more appropriate. At the same time, the system looks very simple and not overloaded with unnecessary elements. It can even be used by a novice trader.
Trading Rules
BUY Signal:
A blue up arrow and a blue band appear.
Trend information dashboard shows 3 blue bars T1, T2 and T3:
Close a position when an opposite signal appears - a red arrow and a red band.
SELL Signal:
A red down arrow and a red band appear.
Trend information dashboard shows 3 red bars T1, T2 and T3:
Close the position when the blue arrow and the blue band appear.
Trades that have only 1-2 red bars (for SELL signal), are not always losing one, they are simply more risky ones. Even the major trend on the highest timeframes has to turn back somewhere and this may be this moment. If you decide to trade with only 1-2 bars confirmation, use a smaller lot. You can also set a tighter Stop Loss:
We can also notice on the above example that the trade generated a small amount of pips (it was probably just a pullback of a higher trend).
Stop Loss order should be placed at:
- the last swing high (for sell trades) or on the last swing low (for buy trades)
PRICE $1,000
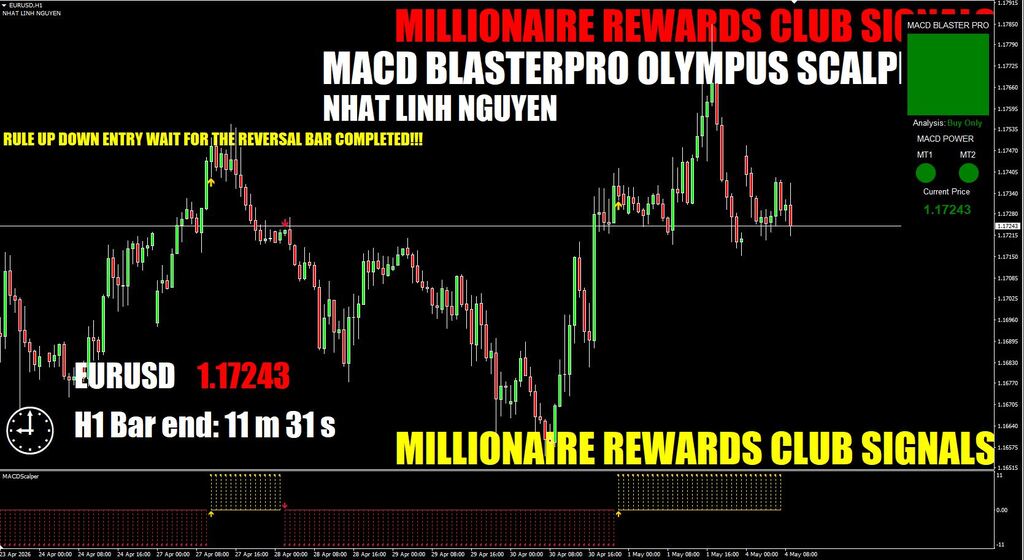
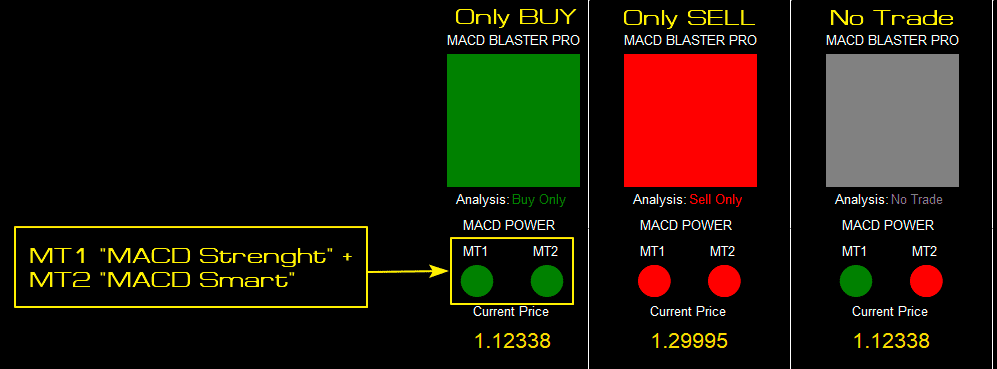
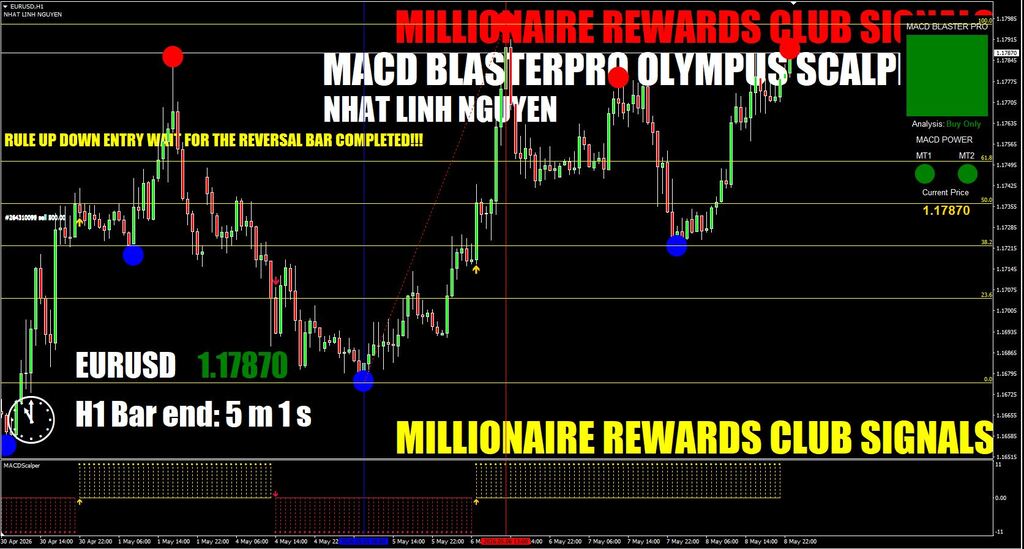
42. MACD Blaster PRO is an advanced trading system based on two indicators, each of which in turn is based on the MACD indicator. The system provides clear and precise signals to enter in the market, which will be understood even by novice traders. The strategy algorithm has a double trend confirmation and is capable of generating a weekly profit of 200-500 pips.
1. MACD Blaster PRO Trend Analysis Smart Window - trend indicator, which shows the current trend direction. Based on its testimony, we will open positions only in the direction of the current trend. And, accordingly, we will ignore the signals against the trend, following the rule #1 of investor - “The Trend is Your friend”.
The “MACD POWER” window displays two components MT1 - MACD Strength and MT2 - MACD Smart. The coincidence of the directions of these two indications determines the general direction of the current trend. Green – Only Sell, red – Only Buy. And the lack of trend in the divergence of the indications MT1 and MT2 - gray square:
2. MACD Scalper Buy and Sell Arrows – signal indicator that indicates the entry point and has a duplicate histogram at the bottom of the chart.
Trading Rules
BUY signal:
Trend Analysis Smart Window is green
MACD Scalper draws yellow upward arrow
A yellow bar appears on the histogram:
SELL signal:
Trend Analysis Smart Window is red
MACD Scalper draws red downward arrow
A red bar appears on the histogram:
For other timeframes there is no data, you need to select it yourself.
It is also worth noting that MACD Blaster PRO is 100% no repaint trading system. Additionally equipped with Popup Alerts, Push Alerts and Email Alerts. However, despite the fact that the authors assure us that the system “ has been rigorously tested in real-time”, do not trust anyone until you check the profitability of the system on a demo account.
PRICE $1,000
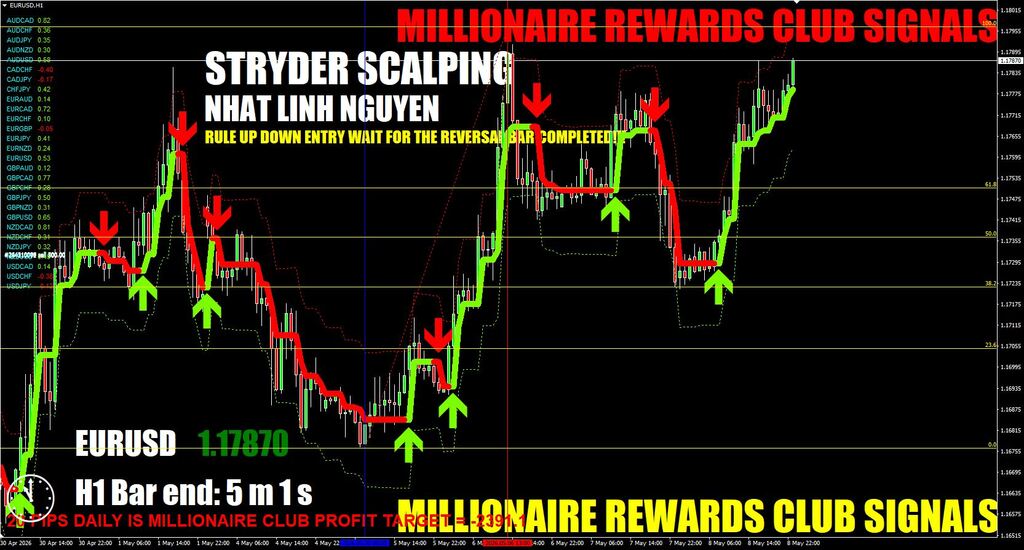
43. Forex Stryder Strategy finds strong mini-trends at the very beginning of its formation, which gives you the best trading opportunities. Thanks to this strategy, you will have the opportunity to enter the market at the right time without delay. The strategy is designed to save the trader from emotional worries and uncertainty in making decisions to enter the market. Strategy signals are never repainted after the signal has formed.
Trading Rules
Trading rules are very simple. There is a main Forex Stryder Signals indicator in the form of arrows and an additional ROC indicator, which serves as a confirmation for the main indicator.
Buy:
A green arrow appeared
Sell:
A red arrow appeared
To set Stop Loss, you can use the green (for Buy) and red (for Sell) borders of the channel.
Take Profit - depending on the timeframe. Exit when the opposite signal appears.
In trading, risk only the money that you can afford to lose. Be sure to practice on a demo account.
PRICE $1,000
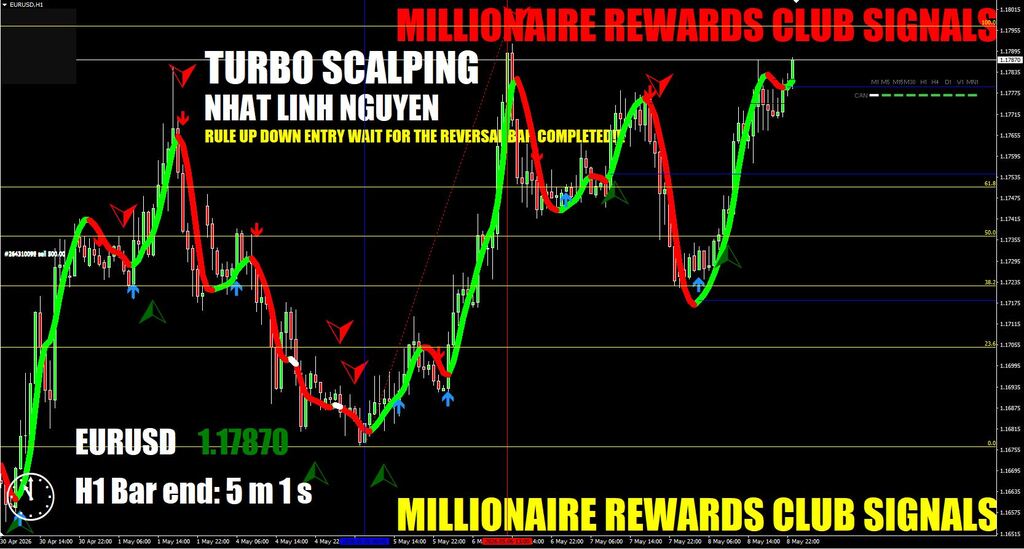
44. Turbo Scalping is a classic forex strategy, built on a combination of the oscillator Hull master MA and the trend-following indicator Stoch Crossing. Among other things, the strategy has additional filters and support / resistance levels that help the trader to determine the entry point and correctly set Take Profit and Stop Loss. Thus, we have a completely autonomous trading system, which is also quite simple to use and not overloaded with unnecessary indicators. Turbo Scalping Forex Strategy is well balanced and will be understood even by novice traders.
Trading rules
The rules of trading are very simple. We only need the coincidence of the signals of the two indicators.
BUY:
Hull master MA is green
A green up arrow appears from the Stoch Crossing indicator:
SELL:
Hull master MA is red
A red down arrow appears from the Stoch Crossing indicator
Stop Loss should be set above/below the previous local maximum/minimum or at the support/resistance level from the PivotsD indicator, as shown in the image above.
Take Profit should be set at a ratio of 11:1 with Stop Loss (in my opinion, this is a bit too much). It would be better to use for this all the same Pivot levels from the PivotsD indicator.
In the end, we can say that this system is a worthy forex strategy that can bring profit. But as any trend system is not without its drawbacks. Therefore, be sure to make sure that you have mastered trading with Turbo Scalping strategy on a demo account.
PRICE $1,000
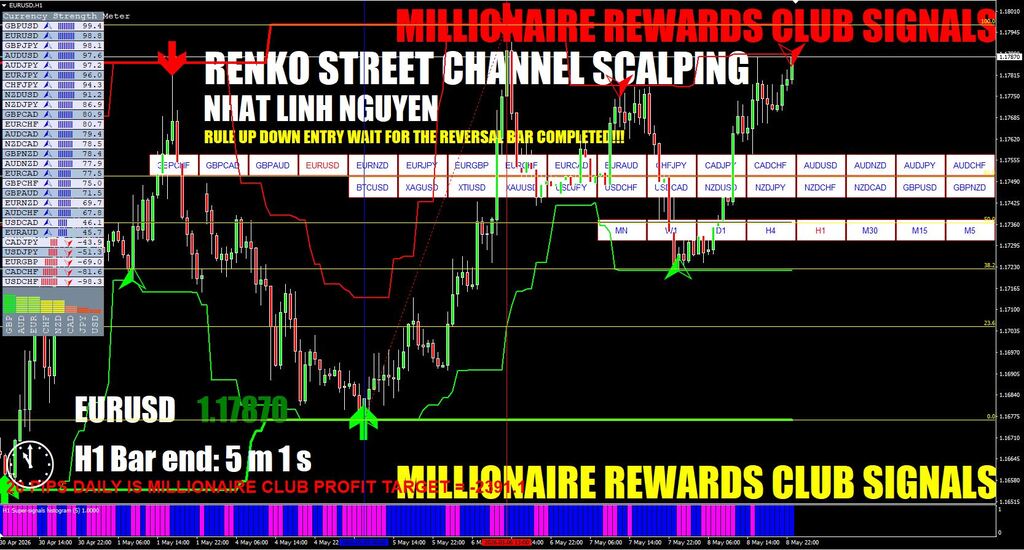
45. Renko Street Trading System is a very interesting trading system based on Renko charts. The strategy is easy to use (even a beginner will master), equipped with simple rules for installing Stop Loss and Take Profit. The system is devoid of repainting indicators and the number of false signals has been reduced due to Renko charts. Renko Street can be used to trade in any trading session, whether it be the London, New York or Asian sessions.
Trading rules
As I said before, Renko Street is built on the use of Renko charts. That gives it some advantages and reduces strong trading noises. What are these charts, you can read more in Investopedia. I will not quote here. Let me just say that, compared to traditional candlestick charts, Renko charts make the decision-making process much easier.
Before you install the template strategy to the chart, we need to do some preparation. Namely, prepare the chart and generate on it the Renko chart. This will help us EA RenkoLiveChart_v3.2, which comes with the system. The sequence of the system installation.
BUY Signal:
RenkoStreetMTF is green and shows an upward trend
Price pushed off the RenkoStreet_Channel and a green dot appeared
RenkoStreet_Trend is green
SELL Signal:
RenkoStreetMTF is red and shows an downward trend
Price pushed off the RenkoStreet_Channel and a red dot appeared
RenkoStreet_Trend is red
Stop Loss (SL) and Take Profit (TP) set on the borders of the channel as shown in the images.
The author of the system proposes to additionally install the second Take Profit (TP2) and use trailing stop.
Remember, no matter how profitable and accurate the trading system, but the market is insidious. Therefore, always pre-test on a demo account.
PRICE $1,000
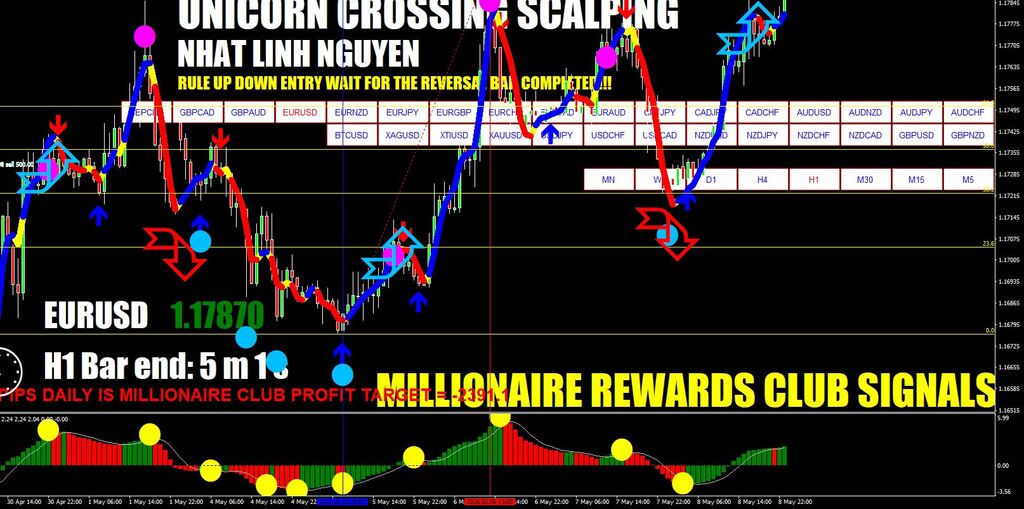
46. Uni Cross Alerts Trading System is based on the indicator of the same name, which in turn uses the indications of indicators T3 and TMA. The Uni Cross Alerts indicator combined with Awesome 3-1 are the heart of the system. The combination of signals from both of these indicators is a signal to enter the market.
Trading rules by the Uni Cross Alerts Trading System
The signal is generated when the signals of Uni Cross Alerts (blue / red arrows) and Awesome 3-1 (blue / yellow dots) coincide.
BUY signal - blue dot + blue arrow.
Sell signal - yellow dot + red arrow.
Open a position after the signal bar is closed, if the signal has not disappeared:
Of course, trading should begin only with a demo account and thorough testing.
PRICE $1,000
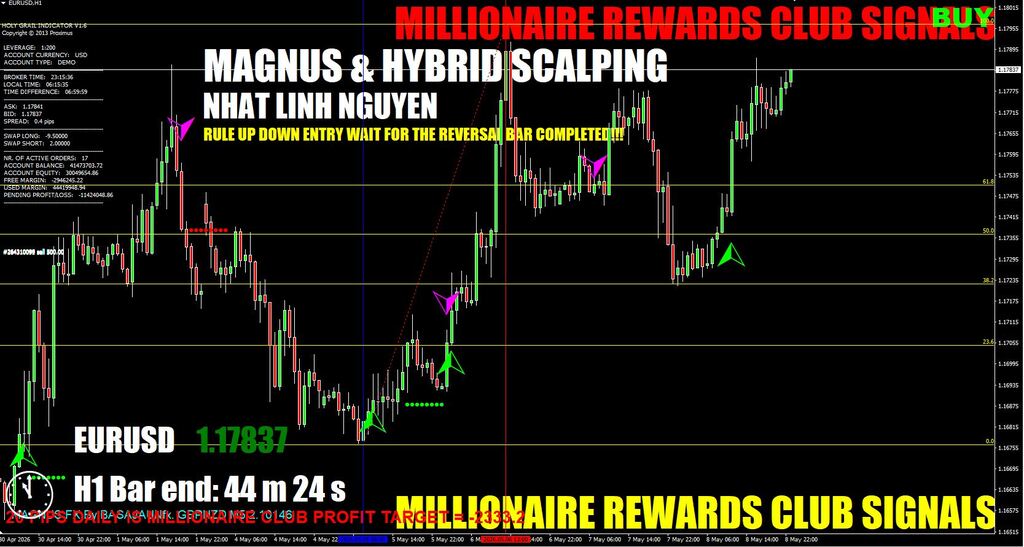
47. Magnus FX Hybrid Trading System, its creator promises us a profit of up to 73% in just 55 days. Whether this is a lot or not, let each of you decide for yourself. But these figures are more like the truth than the incredible profits that other self-named "Trading Gurus" promise us. The signals of the system 100% are not repainted and determining the entry point does not need much experience and knowledge - just follow the recommendations below.
To enter the market we need three factors - signals from the above three indicators:
For BUY:
- Green short line (MAGNUS)
- Yellow wide line (MAGNUS FX)
For SELL:
- Red short line (MAGNUS)
- Yellow wide line (MAGNUS FX) Accordingly, if this condition is not met, we do not open the trade:
Stop Loss should be set slightly above/below (by a few pips) the previous local High/Low. And exit the trade when the opposite signal appears or at Take Profit, which is equal to 2(3)*StopLoss.
The author of this strategy explains it more clearly in this video (the video is in Spanish, there are English subtitles):
Like any other Magnus Hybrid FX system can be improved by you with additional indicators-filters, which can increase its accuracy.
Before using it in real trading, be sure to practice on demo account. Do not forget about mani-management and important economic events.
PRICE $1,000
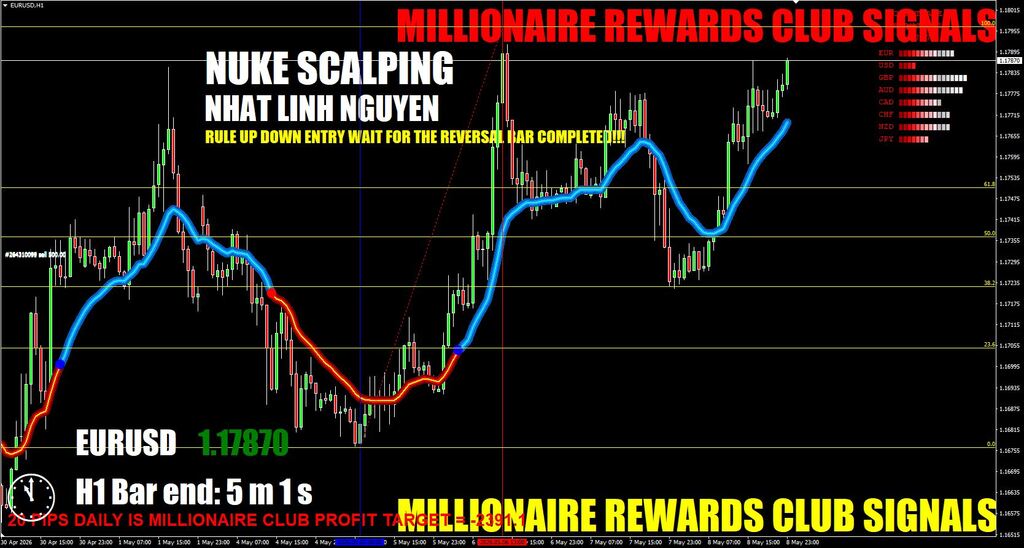
48. FX Nuke Trading System very interesting trading system, but based on the "latest advanced algorithms" to find you the most accurate and profitable BUY/SELL signals. The system implemented a filter in the original way through the CS dashboard, which helps us with choosing the best currency pair. FX Nuke is a universal trading system and is suitable for a trader of any level with any trading style, because this system implements three trading styles: scalping, day trading and swing trading (can be installed by selecting the appropriate template).
Trading rules
FX Nuke Trading System is equipped with two indicators:
Entry / Exit Colored Snake - the main signal indicator. The blue color - BUY, the red color - SELL.
Currency strength and weakness dashboard – filter. This indicator helps us determine the desired currency pair. With it, we can better understand what currency is overbought or oversold. Read more in the manual (you can download it below by clicking on the "Download" button).
BUY rules:
When blue DOT appears, the market is ready for buy signal:
Transaction should remain open, until red DOT appears.
SELL rules:
When red DOT appears, the market is ready for sell signal:
Transaction should remain open, until blue DOT appears.
Stop Loss should be set at several pips above/below the last local high/low.
Take Profit = Stop Loss for conservative trading.
Take Profit = 2 x Stop Loss for aggressive trading:
Of course, the FX Nuke Trading System is not a grail and has its drawbacks. And in order to reduce unwanted losses to a minimum pre-use demo account.
PRICE $1,000
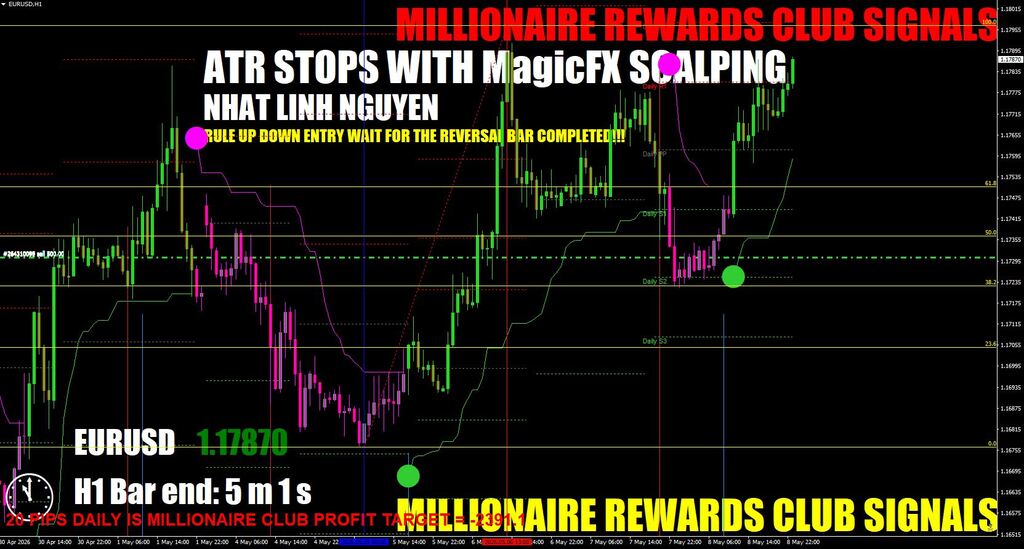
49. ATR Stops with Magic FX is based on two indicators, of which, in fact, the name of the strategy consists of. The idea of the strategy is to generate signals to enter the market using the ATR Stops indicator and filtering with the Magic FX indicator. The system can be used on all timeframes, but the author recommends H1.
Settings for indicators
For the ATR Stops and Reverse indicator, depending on the timeframe used, the following settings should be applied:
- for М5: Time frame - 15 Minutes, Triple Exponential moving average - TEMA, ATR period 10;
- for М15: Time frame – 30 Minutes - 1 Hour, Triple Exponential moving average - TEMA, ATR period 10;
- for Н1 - Н4: Time frame - 1 Hour, Triple Exponential moving average - TEMA, ATR period 10.
Magic Fx - default settings.
Lower Indicator - Market Hour is informative in nature and is required to clarify the current trading session.
Rules of trade by ATR Stops with Magic FX
BUY:
Green line from the ATR Stops
Appeared a blue vertical line from the Magic FX
SELL:
Red line from the ATR Stops
Appeared a red vertical line from the Magic FX
Stop Loss is set at a distance of 2 pips from the line of the ATR Stops indicator.
Take Profit is set according to the trend, depending on the currency pair and timeframe. It is possible to close a position when an opposite signal appears or when the price reaches one of the pivot levels.
ATR Stops with Magic FX is a fairly simple system, with simple and clear rules that are accessible even to beginner traders. But no less, before using this system on a real account, be sure to test it on a demo.
PRICE $1,000
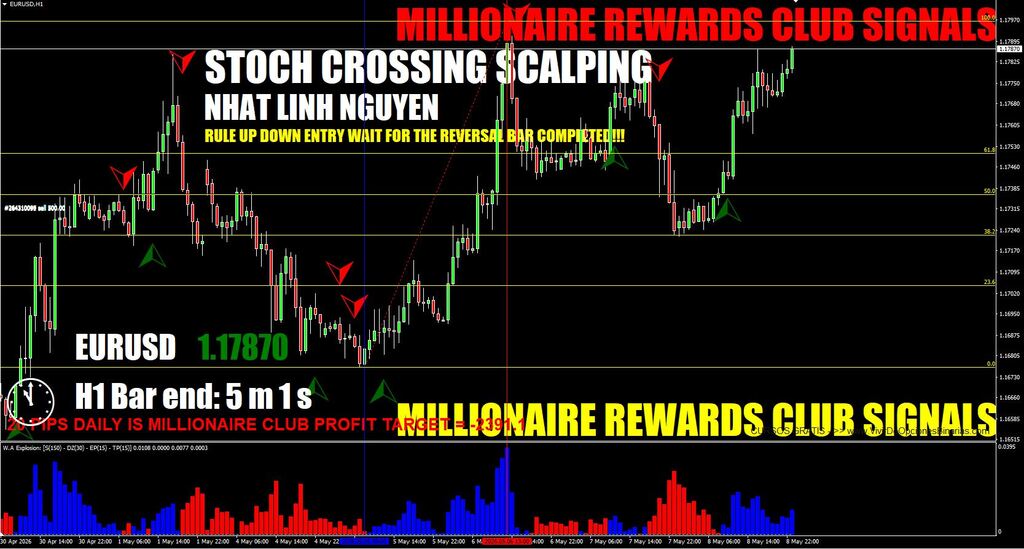
50. Stoch Crossing Strategy is designed for day trading and is based on using only two technical indicators. The strategy is trend oriented and has a completely uncomplicated trade rules, which will be accessible even to beginners. You can use it for any trading assets, but preference should still be given to the major currency pairs.
- WAExplosion (150, 30, 15, 15)
- StochCrossing (30, 10, 10) - "slow" version of indicator settings, most suitable for trading on the trend
Rules of trade
BUY signal:
Appeared green arrow up
On the WAExplosion indicator the green bar is above the yellow line:
SELL signal:
Appeared arrow arrow down
On the WAExplosion indicator the red bar is above the yellow line:
Stop Loss is initially set above/below the previous local maximum/minimum.
Take Profit is set fixed, depending on the time frame and currency pair used. It is also possible to close the position when the arrow of the StochCrossing indicator appears in the opposite direction.
As you can see the Stoch Crossing System is very simple and gives accurate signals to enter on the market. Before real trading you need to practice on a demo account. Only in this way will you become acquainted with all the nuances of strategy.
PRICE $1,000
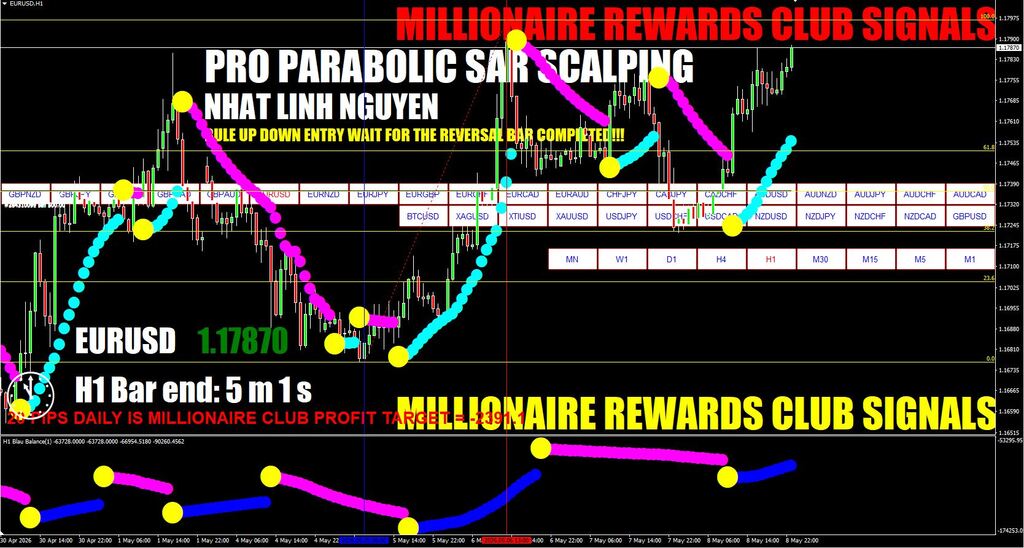
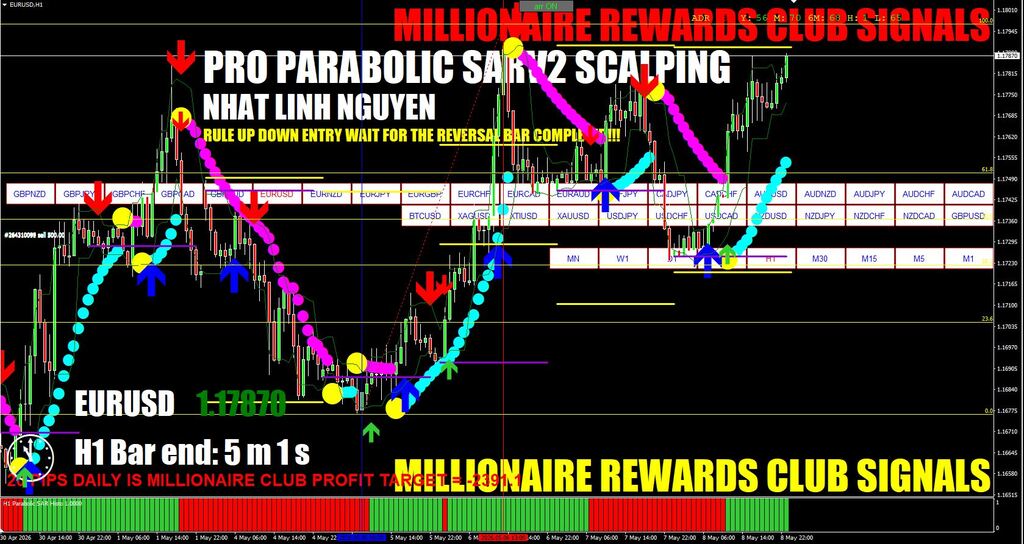
51. Pro Parabolic Blau Balance System is a successful combination of two indicators: Pro Parabolic Sar and Forex Blau Balance Indicator. How often do I say that no matter how accurate the indicator is, it always needs an additional filter. It is in this strategy that both indicators perfectly complement each other. The system should be used preferably on high timeframes and, preferably, in the direction of the current trend. Remember that the trend is your friend.
Rules of the trade
BUY when:
Appeared green arrow (Pro Parabolic Sar)
Appeared green dot (Forex Blau Balance Indicator):
SELL when:
Appeared red arrow (Pro Parabolic Sar)
Appeared red dot (Forex Blau Balance Indicator):
EXIT when changing signals to the opposite.
Stop Loss below / above the previous local minimum / maximum.
Take Profit with ratio 1.1 Stop Loss.
PRICE $1,000
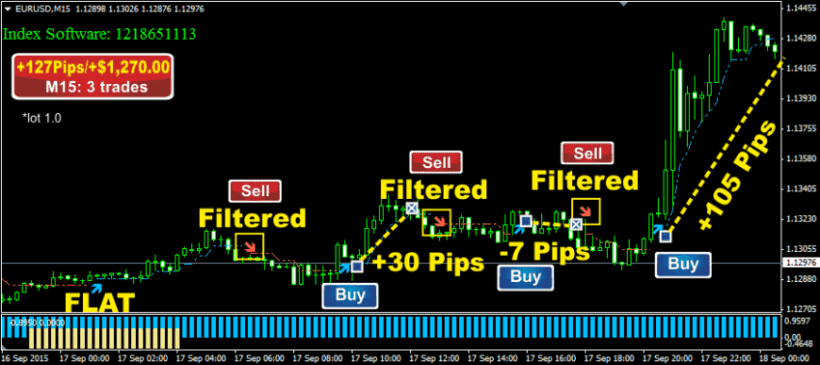
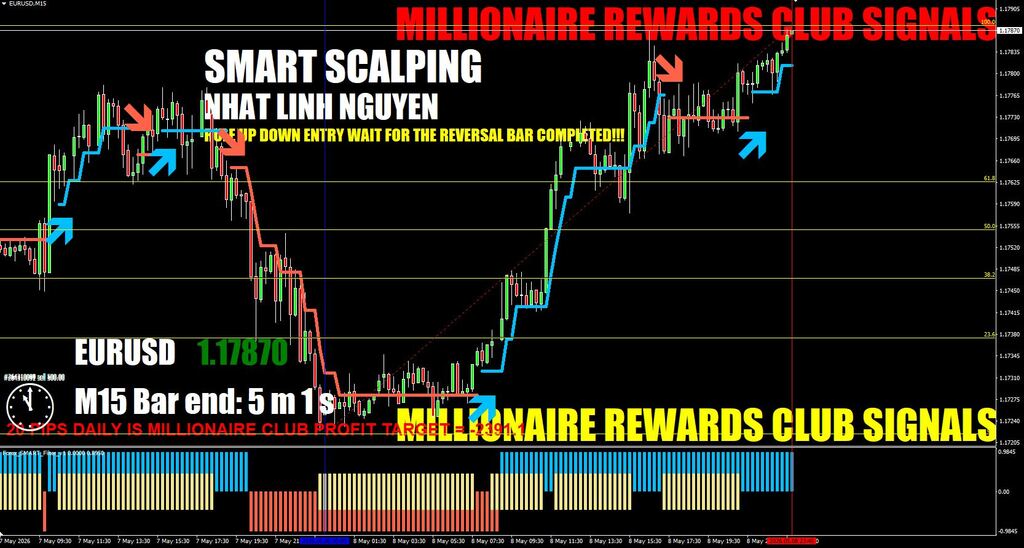
52. Forex Smart Scalper is a trading system designed for scalping on M5 and M15. It consists of two indicators: the main signal indicator (Forex Smart Scalper) and the filter (Forex Smart Filter). Apply Forex Smart Scalper follows on the main currency pairs in the busiest trading hours - the London and New York sessions. The system is very simple and understandable, so even a beginner trader will cope with it.
Rules of trade by Forex Smart Scalper
After installing the Forex Smart Scalper in the terminal MT4, you will see signals in the form of blue (Buy signal) and red (Sell signal) arrows, and a filter of blue (Buy Zone), red (sell Zone) and yellow (Flat) bars:
Buy signal:
Blue arrow
Blue bar
Sell signal:
Red arrow
Red bar
A few more examples of trading from the developer:
EURUSD, M5 performance: + 139 pips (+$1,390) in FEW HOURS!
EURUSD, M15 performance: + 127 pips (+$1,270) - 1 trade!
GBPUSD, M5 performance: + 50 pips (+$500)
USDCAD, M15 performance: + 140 pips (+$1,400)
USDCHF, M5 performance: + 128 pips (+$1,280) - 3 trades!
Stop Loss should be placed on the nearest local minimum/maximum.
Exit when the opposite signal appeared.
Of course, the Forex Smart Scalper system needs training and testing on a demo account.
PRICE $1,000
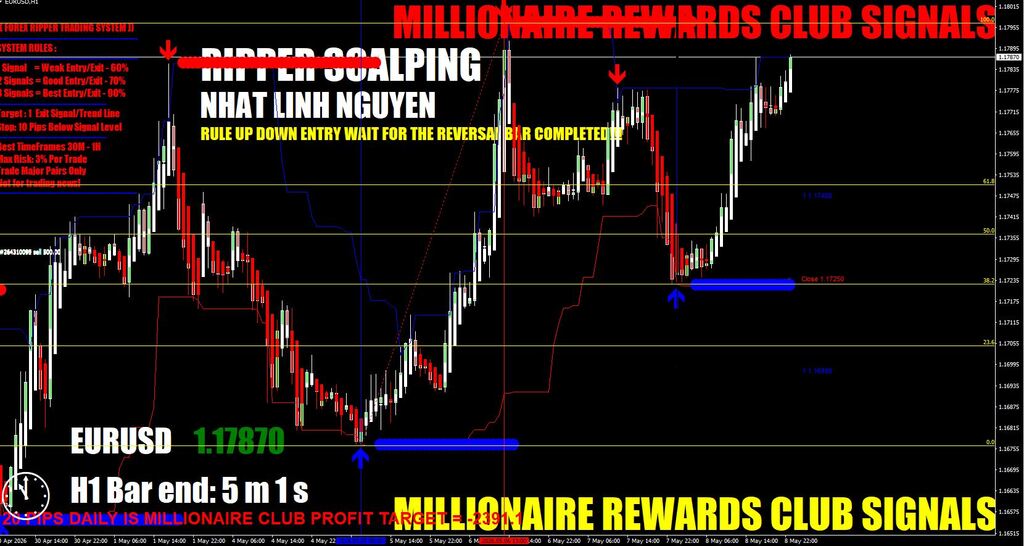
53. Forex Ripper Trading System is designed for trading on major currency pairs with a timeframe of M30 and higher. The system has clear signals to enter the market and clear signals to exit the position and capture the target. The Forex Ripper Trading System is extremely clear and suitable for traders with any trading experience.
The Ripper Trading System for MT4 is versatile, suitable for Forex currency pairs, stocks, commodities, cryptocurrencies, precious metals, oil, and gas. It is effective across all timeframes, from the 1-minute to the 4-hour charts, with peak performance on the M30 and H1 timeframes.
Rules of trade
The author of the strategy offers several options for enter in the market (read the manual). I recommend using only one, the most accurate - when the signals of the three indicators coincide. But you can follow the advice of the author at your own risk.
BUY:
Appeared blue big dot
Appeared blue arrow up
Appeared small dots
SELL:
Appeared red big dot
Appeared red arrow down
Appeared small red dots
Take Profit can be set on the top/bottom line of the channel or exit the position when one of the opposite signals appears.
Stop Loss set to 10 pips above/below the support/resistance line.
PRICE $1,000
54. Most of us appreciate in the trading system's profitability and efficiency. And if it is also an easy to use system, then it is priceless. Meet just such a trading system - Day Trading with Parabolic Sar. The work of the Day Trading with Parabolic Sar is based on the basic arrow indicator (arrows & curves) with a filter, which is the well-known Parabolic Sar.
Rules of trade by Day Trading with Parabolic Sar
As I have said, this strategy is very easy to use with simple rules for opening a position.
Blue arrow above the dot of Parabolic Sar
Sell:
Red arrow below the dot of Parabolic Sar
Stop Loss should be installed:
- at the nearest local minimum / maximum
- slightly lower / higher the points of Parabolic Sar, respectively
Close position when:
- at the pivot points levels
- when an arrow appears in the opposite direction
- when the Parabolic Sar dots appear above the price (for Buy) or under the price (for Sell)
And, it will be better if the opening of the transaction coincides with the direction of the trend. Do not forget - the Trend is your Friend!
PRICE $1,000
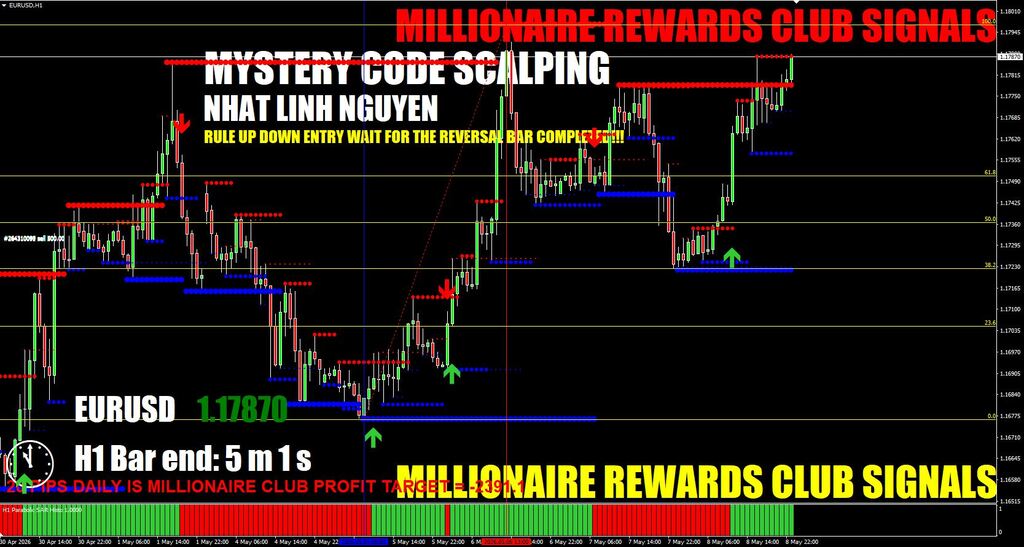
55. Mystery Code System uses only two indicators, which makes it very simple and at the same time profitable trading system. The main indicator Mystery Data is not repainted and displays the Buy/Sell arrows on the chart to open positions. The second indicator Histox acts as a filter.
Rules of trade by FX Mystery MT4 System
BUY:
ppears a blue arrow from the Mystery Data indicator
The histogram of the Histox indicator is also blue
Exit at the appearance of the opposite signal (red arrow):
SELL:
Appears a red arrow from the Mystery Data indicator
The histogram of the Histox indicator is also red
Exit at the appearance of the opposite signal (blue arrow):
Despite the seeming simplicity, it is necessary to work with this strategy on a demo account. And only after the emergence of a positive trend, you can move on to real trading.
PRICE $1,000
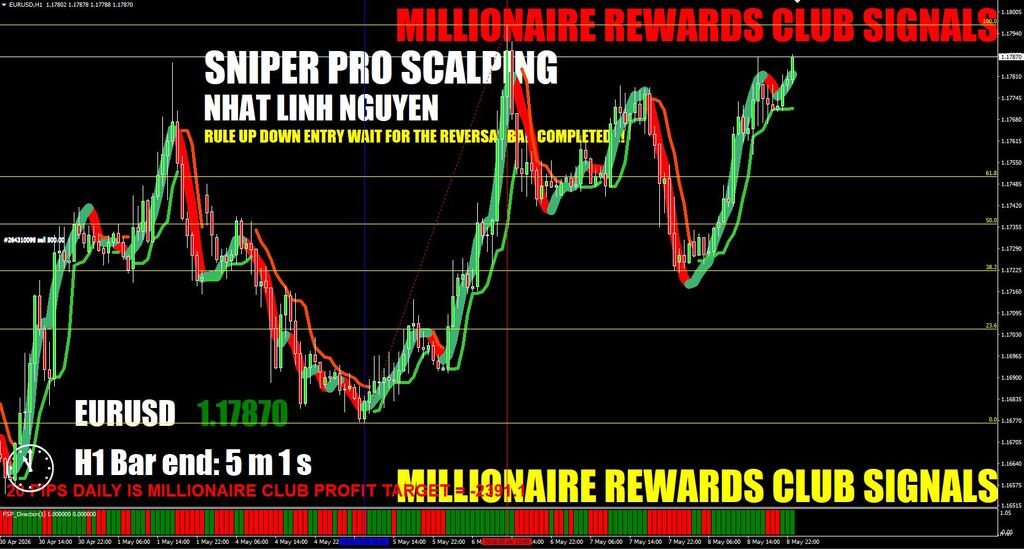
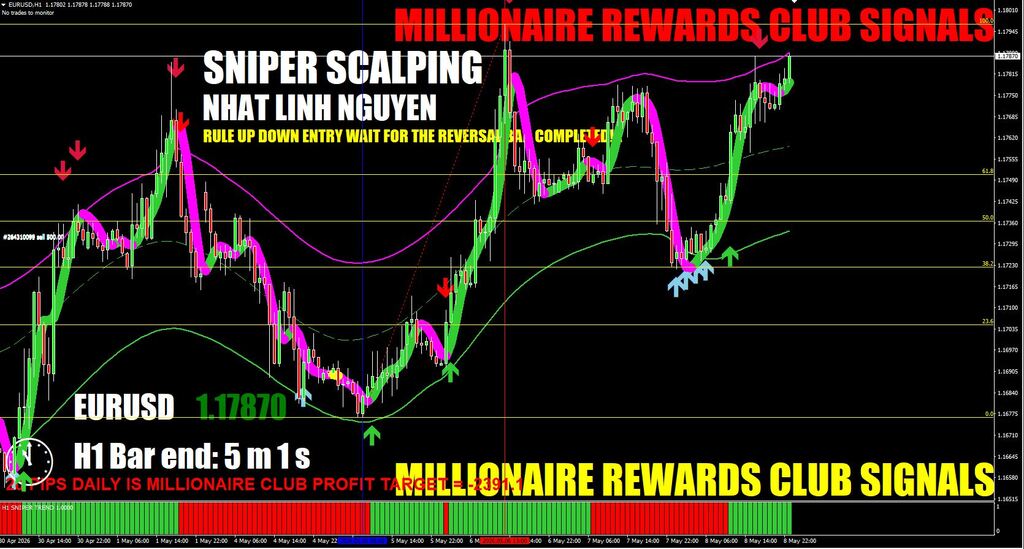
56. Sniper Forex version 2 is intended for trading on H1 timeframe. This forex trading system works on any currency pair, but the best results are shown on the currency pair GBPUSD. Sniper Forex v2 is very easy to use, because is equipped with warning sound alerts.
Rules of trade by Sniper Forex v2
Buy:
Lines of Sniper indicator change color to blue.
Bars of histogram Sniper Trend painted blue.
As soon as one of the lines of Sniper indicator changes color to blue, the system issues a warning (Alert) about a possible change in trend direction. When you change the color of all three lines of Sniper indicator to blue on the chart appears arrow, showing the possible direction of the trend.
After the appearance of arrows make sure that the histogram bars Sniper Trend A and Sniper Trend B steel blue and only then open a position.
Sell:
Lines of Sniper indicator change color to red.
Bars of histogram Sniper Trend painted red.
Stop Loss is set at the level of the dots Sniper Stop indicator.
When the price reaches 25 pips profit, Stop Loss tolerated to breakeven.
In position we enter with two lots. The first lot is closed when the first Take Profit is taken. For the currency pair GBPUSD is 100 points. The second lot is closed when the lines of Sniper indicator changes color to the opposite.
If you open a position with one lot, then come out of the market or on reaching a profit of 100 points, or when a opposite signal of the strategy or any signal of a possible trend reversal.
Trading strategy Sniper Forex v2, like any other, can be used on a real forex market only after are received consistently good results on a demo account.
PRICE $1,000
57. Sniper Forex is intended for trading on H1 timeframe. This forex trading system works on any currency pair, but the best results are shown on the currency pair GBPUSD. Sniper Forex v2 is very easy to use, because is equipped with warning sound alerts.
Rules of trade by Sniper Scalping
Buy:
Lines of Sniper indicator change color to blue.
Bars of histogram Sniper Trend painted blue.
As soon as one of the lines of Sniper indicator changes color to blue, the system issues a warning (Alert) about a possible change in trend direction. When you change the color of all three lines of Sniper indicator to blue on the chart appears arrow, showing the possible direction of the trend.
After the appearance of arrows make sure that the histogram bars Sniper Trend A and Sniper Trend B steel blue and only then open a position.
Sell:
Lines of Sniper indicator change color to red.
Bars of histogram Sniper Trend painted red.
Stop Loss is set at the level of the dots Sniper Stop indicator.
When the price reaches 25 pips profit, Stop Loss tolerated to breakeven.
In position we enter with two lots. The first lot is closed when the first Take Profit is taken. For the currency pair GBPUSD is 100 points. The second lot is closed when the lines of Sniper indicator changes color to the opposite.
If you open a position with one lot, then come out of the market or on reaching a profit of 100 points, or when a opposite signal of the strategy or any signal of a possible trend reversal.
Trading strategy Sniper Scalping like any other, can be used on a real forex market only after are received consistently good results on a demo account.
PRICE $1,000
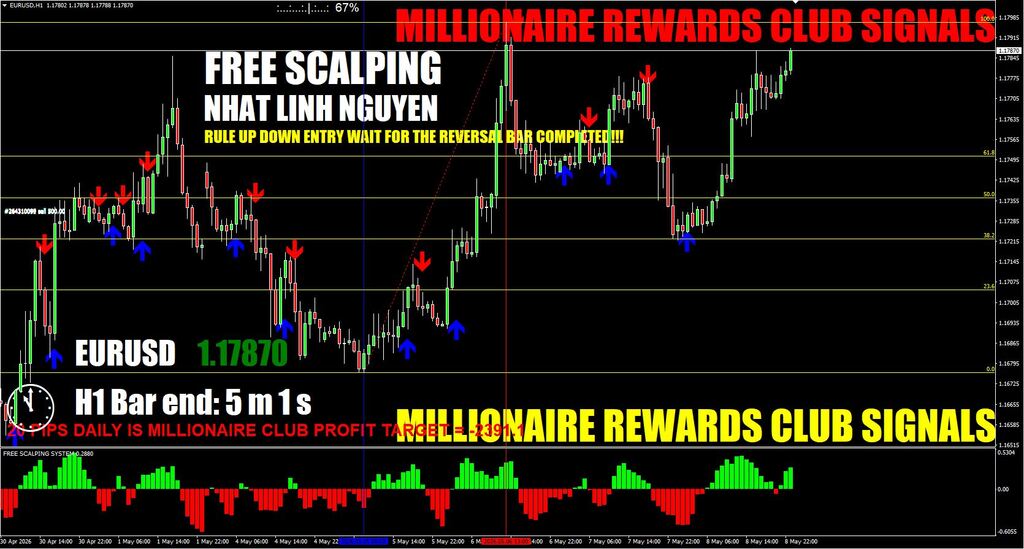
58. Pips Forex Scalping System is very accurate trading system for scalping, which is intended to trade on the timeframes M5 and M15. This scalping system consists of only 2 main (ArrowsAndCurves, freescalpingindicator) and one additional (BarTimer) indicators, which makes this strategy is also very simple.
Rules of the trade
Open Buy:
Appeared blue up arrow.
Free Scalping Indicator displays a green bar.
Open the Long position on the next candle.
Take Profit 20 pips daily.
Stop Loss is set at the bottom of the green line indicator ArrowsAndCurves.
Open Sell:
Appeared red down arrow.
Free Scalping Indicator displays a red bar.
Open the Short position on the next candle.
Take Profit 20 pips daily.
Stop Loss set at the upper of the green line ArrowsAndCurves indicator.
PRICE $1,000
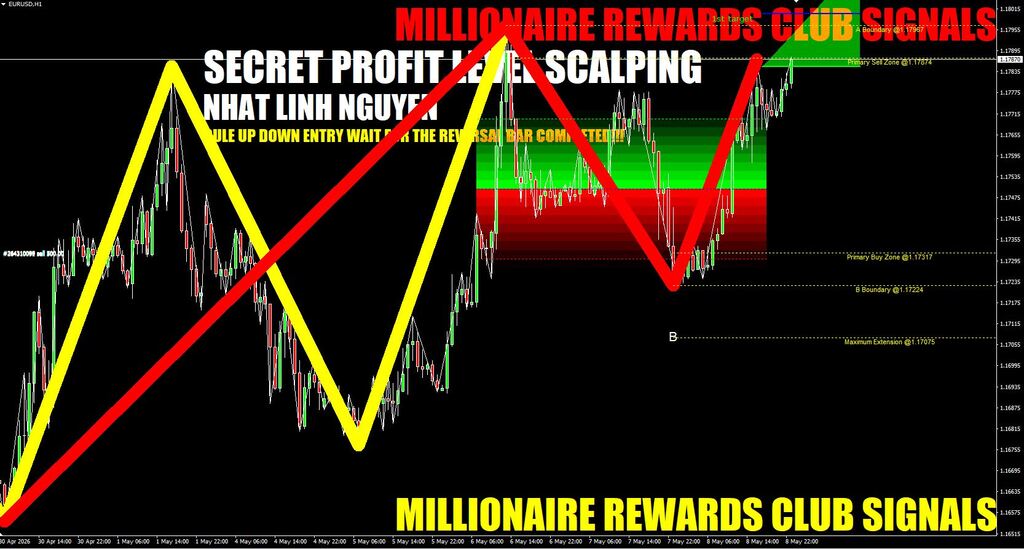
59. Secret Profit Levels is as old as the market itself and is so profitable because of its universality. I will also share custom indicator that will help you trade this strategy with ease. But first, let’s go through the basics that lie behind this strategy.
The trading system Secret Profit Levels is about the secret levels that exist on your charts, yet 99.9% of the traders don’t know about them. And although they are easy and simple to trade, once you see how profitable they are, you’ll understand why the big hedge funds and financial institutions are keeping it as a secret to be used by them only.
It is believed is that these high frequency trades create large pools of money at certain levels on a chart. But they are invisible to everyone except those big players placing the trades. Meaning that until now the average trader had no way of knowing where these pools of wealth were hidden.
Those Secret Profit Levels are actually round numbers on the chart and they work so well because it’s in human nature to tend to round numbers. It’s human psychology.
Those levels act as magnets. As soon as price gets close they will attract it, giving you the chance to enter the trade and make money.
Secret Profit Levels indicator will show you where to enter the trade and where to exit the trade, which will help you boost your confidence, whether you are an experienced trader or a beginner.
BUY TRADE RULES
The trend must be heading up.
Wait for the price to climb up towards a round number level. We want the price to break 2/3rds of the entire range between 2 round numbers. For example, if we are in uptrend on the EUR/JPY and price is in between the 136.000 and 137.000 levels, we want the price to climb up above 2/3 of this range or above the 136.670 level to consider that as a possible long trade set up.
As soon as price reaches 15 pips below the next round number, we can open a buy order. If we use the same example with the EUR/JPY pair above, as soon as price breaks the 136.850 level, we can go long. We can also use a pending order to enter trades.
The stop loss is set 15 pips under the entry point.
We have 3 options in setting the take profit – Conservative, Aggressive and Managed.
Conservative exit – The next round number. In the EUR/JPY example above, our first target is the 137.000 level.
Aggressive exit – This is the round number level plus 20 pips.
Managed exit – Here, we close half of our position on the round number level, then move our stop loss level to the break even and close the rest at the round number plus 20pip This way, we can lock in some profit and preserve it by moving the stop loss to break even.
Note: Your SL and TP should be based on your own risk/reward tolerance, and never risk more than what you see as your profit potential.
SELL TRADE RULES
The trend must be headed down.
Wait for the price to decline towards a round number. We want the price to break 2/3rds of the entire range between 2 round numbers. For example, on the EUR/USD, if price is between the 1.2800 and 1.2900 levels, we wait for the price to decline 2/3 of this range or below the 1.2833 level to look for a possible short trade set up.
As soon as price breaks below the next round number minus 15 pips, we can open a sell order. In our example, as price breaks below the 1.2815 level, we can go short. We can also set a pending sell order instead of waiting for the price to reach that level.
Set the stop loss 15 pips from the entry point.
We also have 3 options for setting the take profit – Conservative, Aggressive and
Managed.
Conservative exit – The next round number. In our example, our first target is the 1.2800 level.
Aggressive exit – This is the level 15 pips below the round number. In our example, it will be at the 1.2785 level.
Managed exit – Here, we close half of our position when price reaches the round number, then we move our stop loss to break even and close the rest 15 pips below the round number.
Note: Your SL and TP should be based on your own risk/reward tolerance, and never risk more than what you see as your profit potential.
PRICE $1,000
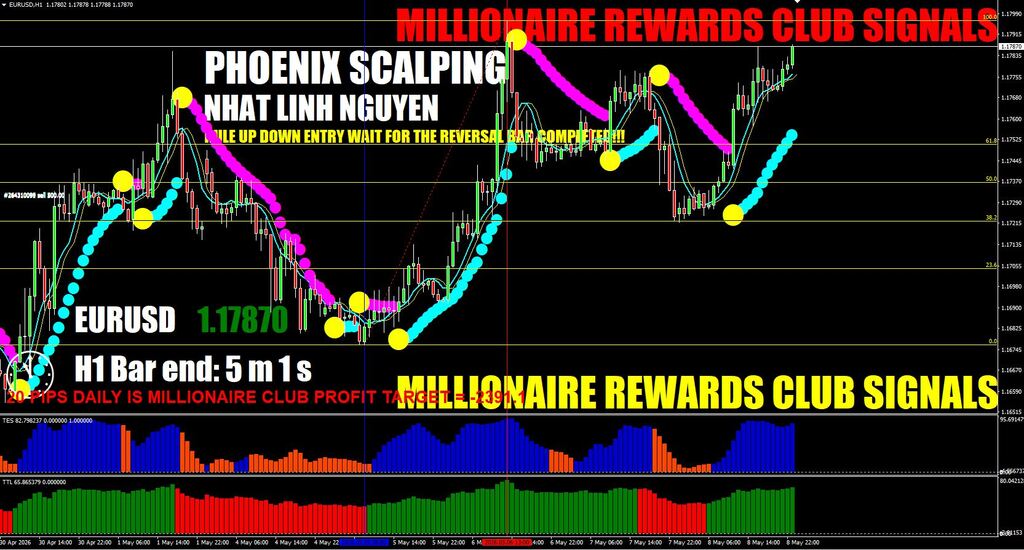
60. In this article we will discuss the new scalping strategy New Science of Forex Trading (NSOFT). This strategy is very popular and discussed on many popular blogs and forums. The strategy of actively sold on Clickbank, but that did not stop one of the buyers to provide this system for our website. That's how it is paid quickly turns into a free.
Characteristics of PHOENIX SCALPING of Forex Trading
Platform: Metatrader4
Currency pairs: Any, recommended major
Trading Time: Around the clock
Timeframe: M5 and higher
Recommended broker: RoboForex, InstaForex, Forex4you
Signals of Strategy phoenix scalping Forex Trading
In the strategy stipulated a comparison of the trend with a larger timeframe, that is, if we work on the M5, the confirmation of the signal are looking at M15. Analyze signals in accordance with the following scheme:
To enter a long position should be simultaneously compliance with a number of the following terms:
Moving Average indicator with a period of 6 blue line crosses the Moving Average indicator yellow from the bottom up
Point of DED indicator should be blue
Bar of an indicator histogram TES should be blue
Bar of an indicator histogram TTL colored green
If all conditions were met, go to M15 (if we trade on M5) and look at the histogram indicators TES and TTL, their bars shall be painted blue and green. If the signal is confirmed we open a long position:
Signals to open a Short position
To enter a Short position should be simultaneously compliance with a number of the following terms:
Moving Average indicator with a period of 6 blue line crosses the Moving Average indicator yellow from the top down
Point of DED indicator should be yellow
Bar of an indicator histogram TES should be orange
Bar of an indicator histogram TTL colored red
If all conditions were met, go to H4 (if we trade on H1) and look at the histogram indicators TES and TTL, their bars shall be painted orange and red. If the signal is confirmed we open a Short position:
Stop Loss
Stop Loss set in the classical way - namely, on local minimum and maximum or important support and resistance levels:
Exit
Analyzing video reports author strategies, I saw that the way exit of the position is on the set Take Profit, which is equal to the Stop Loss. But looking at the strategy New Science of Forex Trading on history, I venture to suggest that in this way the author goes out prematurely, and can use alternative way, for example, on the opposite signal.
Money Management
In trading, money management is responsible for the stable growth of your deposit. Strategy Phoenix scalping of Forex Trading is positioned as a scalping system, therefore it is strongly recommended not to exceed 1% of the risk in one position.
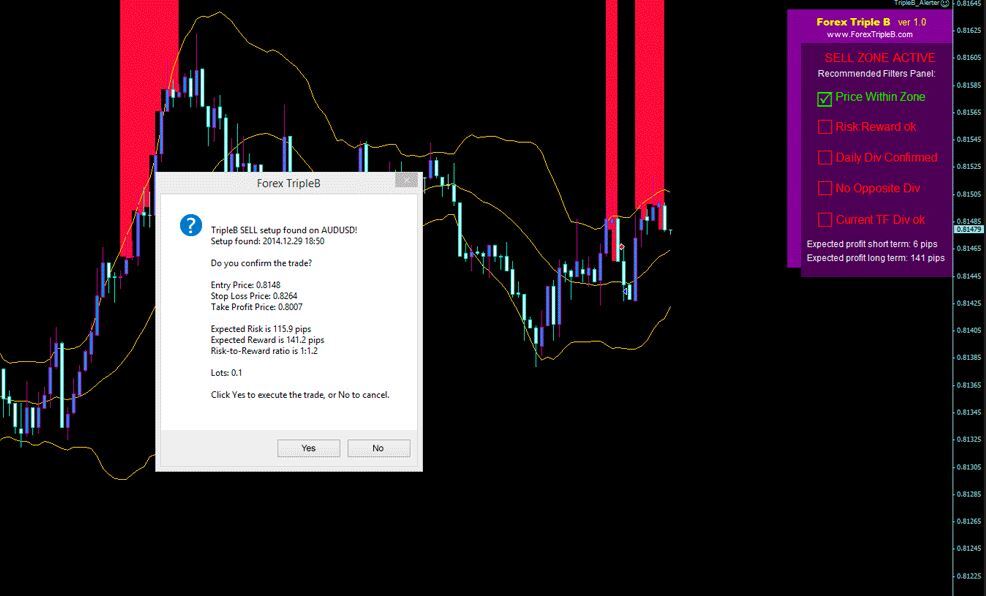
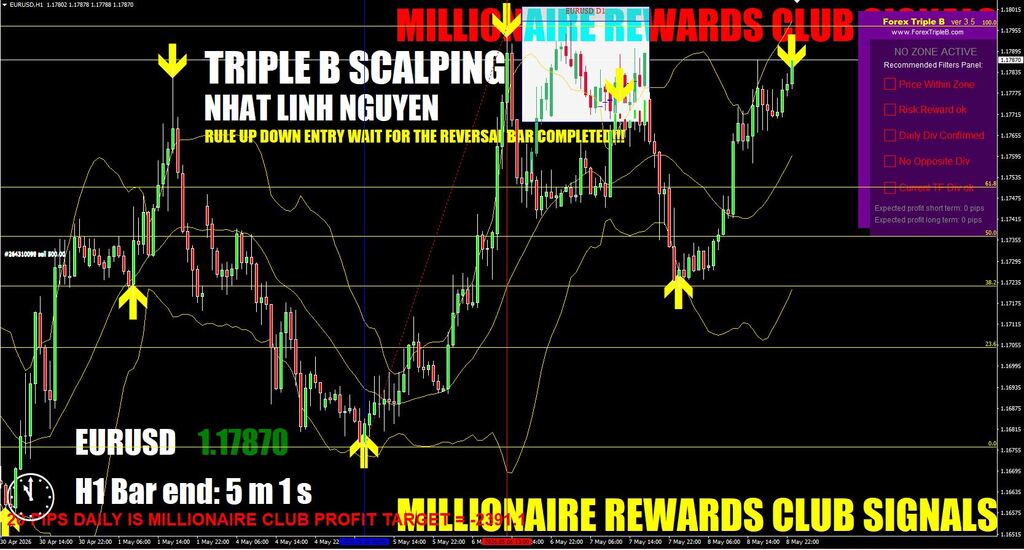
PRICE $1,000
61. Forex Triple B Strategy is a very original semi-automated trading system, which is based mainly on the standard indicator Bollinger Bands. Author of this system Vladimir Ribakov combined three approaches to trade in a single system, trying to satisfy the requirements and the most common methods of marketing and management positions. And he did it. Forex Triple B Strategy does show good results.
Opening a position is made with the help of advisor Triple B Alerter, which is part of the system and displays a window where you can to open a position:
Once the trader clicked "Yes" the adviser continues to maintain open position:
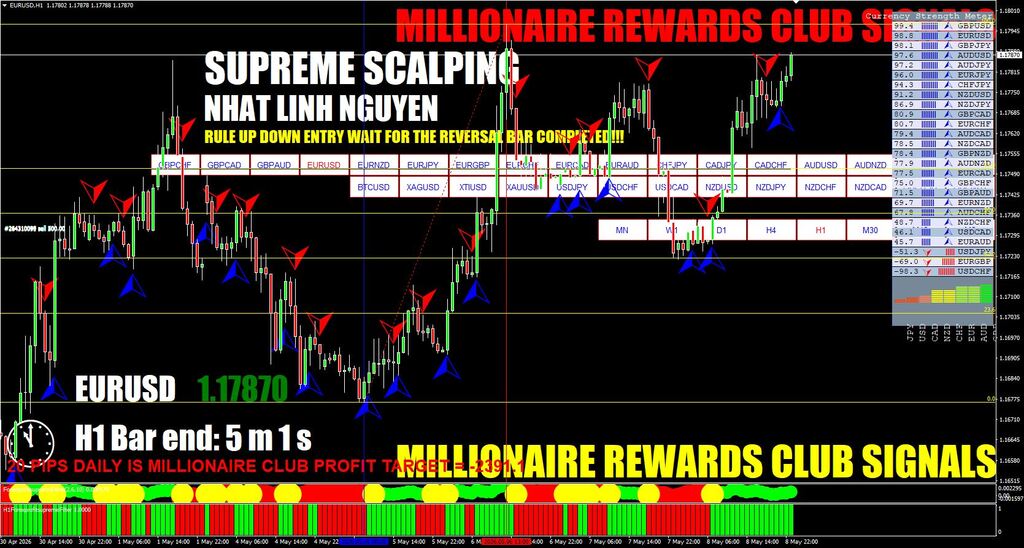
PRICE $1,000
62. Forex Profit Supreme is trading system designed for intraday trading. It signals the entrance to the market grounded on the measurement of six indicators. The peculiarity of this intraday forex strategy is that it was created by the authors for beginners and it does not require any serious skills.
Algorithm for signal analysis by Profit Supreme:
We analyze the most active pairs by the indicator ForexProfitSupreme Meter and preselect tools.
After receiving a signal from the indicator ForexProfitSupreme Signal check on the first indicator as currently actively traded currency pair is selected.
We look at the filters strategies and decide to enter the market.
Rules for opening a long position:
ForexProfitSupremeSignal indicator gave a signal as a blue up arrow.
On the informer Forex Profit Supreme Meter indicated the upward movement of the currency pair.
ForeksProfitSupremeFilter indicator is blue.
ForexProfitSupreme Dline indicator is green and is located above the zero line.
Rules for opening a shot position:
ForexProfitSupreme Signal indicator gave a signal as a red down arrow.
On the informer ForexProfitSupreme Meter indicated the upward movement of the currency pair.
Foreks Profit Supreme Filter indicator is red.
ForexProfitSupreme Dline indicator is red and is located below the zero line.
Exit of position in this strategy is carried out after the appearance of current trend opposite signal indicators.
Please note that the strategy does not work when there is no confirmation of one or more indicators.
In the trade, it is desirable not only to confirm the presence of ForexProfitSupreme Meter the preliminary signal supplied ForexProfitSupreme Signal. But the coincidence actively traded currency with one of the currencies traded in pairs. It amplifies the signal and increase the percentage of successful trades. As well right at the top of the table with the currency is located the most expensive in relation to other currencies, and below is the cheapest.
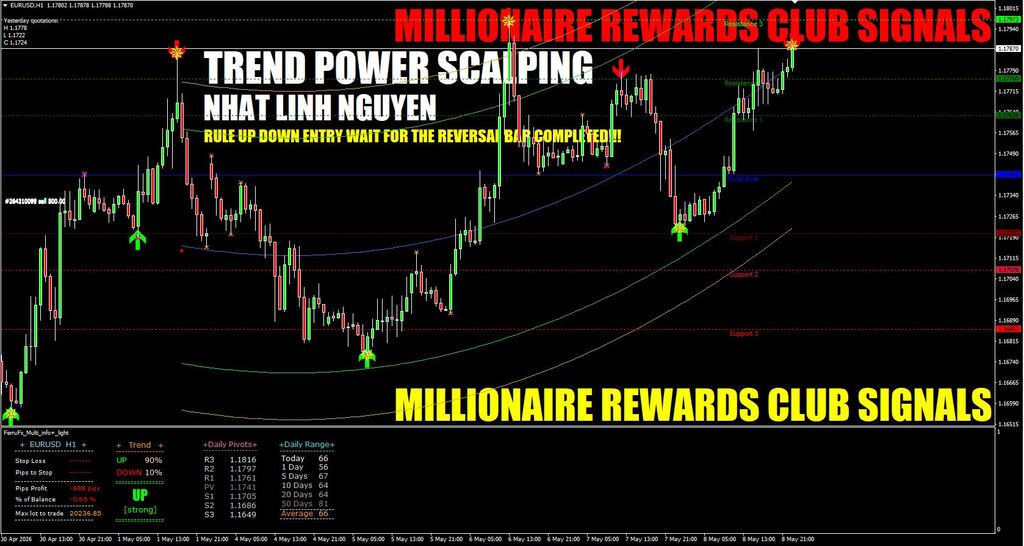
PRICE $1,000
63. Trend Power System is an indicator strategy with dynamic channel support / resistance levels. Can be used on any currency pairs and all time frames. But I would still prefer the H1. There, I think, more reliable signals.
Rules of entry into the market by Trend Power System
Long entry:
Appeared blue arrow up (better if at this time the price is near the bottom of the green line of the channel)
Yellow star indicates a strong signal
Exit, when a signal of the opposite, when you see a red arrow or the price reaches the upper green channel boundaries.
Short entry:
Appeared red arrow bottom (better if at this time the price is near the top of the green line of the channel)
Yellow star indicates a strong signal
Exit, when a signal of the opposite, when you see a blue arrow or the price reaches the bottom of the green border of the channel.
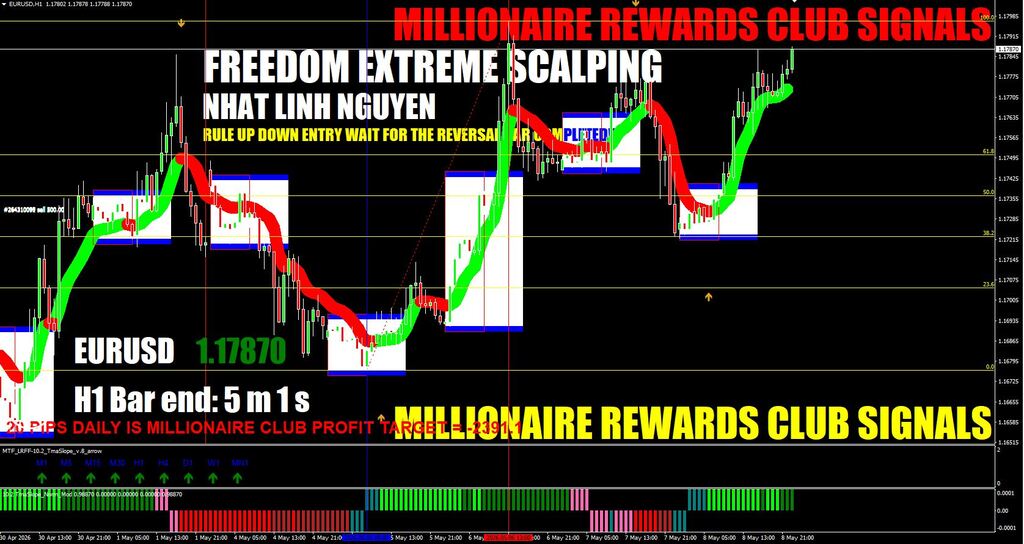
PRICE $1,000
64. Freedom Extreme 4.4 is not difficult system for even a novice to understand. This trading system is equipped with arrows who report about the direction of entry into the market. This strategy is suitable for any currency pair, but better to give preference majors. Trade better on time frames M5 and above.
Rules of entry into the market
Long position:
When a red or yellow arrow pointing up (red arrow - stronger signal)
Indicator 10.2 TMA slope must be green or blue
Indicator ODST_Wave is green
Exit (2 versions):
Conservative - when the indicator ODST_Wave will turn red
Aggressive - when an arrow appears pointing down
Short position:
When a red or yellow arrow pointing down (red arrow - stronger signal)
Indicator 10.2 TMA slope must be red
Indicator ODST_Wave is red
Exit (2 versions):
Conservative - when the indicator ODST_Wave turns green
Aggressive - when you see the arrow pointing up
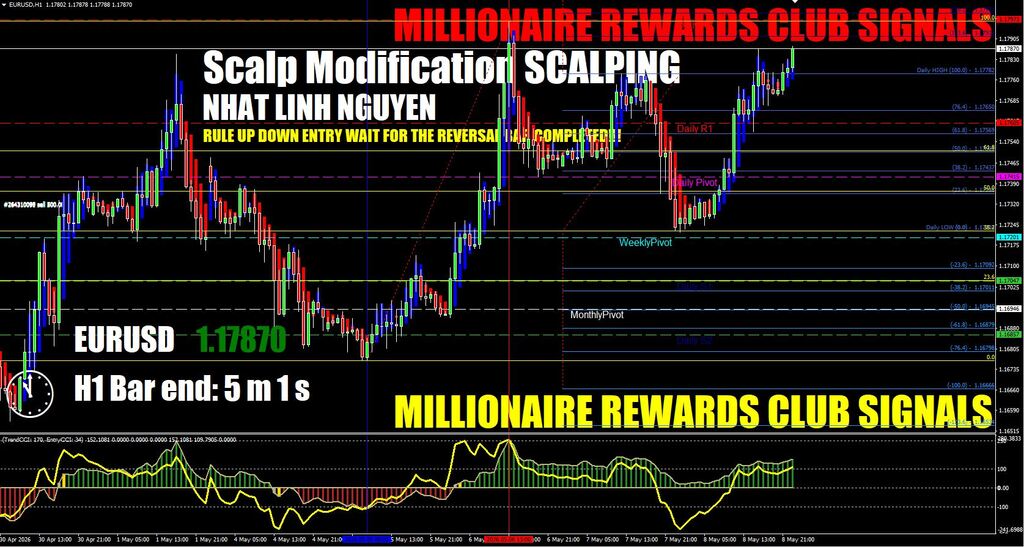
PRICE $1,000
65. Forex Strategy Scalp Modification designed for scalping on all currency pairs and is a very simple and intuitive to use. According to the authors, subject to the rules of strategy brings to 80% profitable trades. Scalp Modification designed for all currency pairs on timeframes M1 and M5.
Rules of long entry:
Trend CCI (170) crossed the zero line upwards; it is over and shows an upward trend
Entry CCI (34) crossed the zero line in the same direction and shows an upward trend
RSI indicator value is greater than 55
Heiken Ashi indicator changed color to blue
It is important to remember that perform at the entrance to the market value of the RSI indicator in the area of 45-55 risky. You should wait for the intersection of value 55 in the direction of trade.
Stop Loss in the strategy is fixed and amounts to 10 points.
Exit the long position if the following conditions:
Heiken Ashi indicator changed color to red
CCI (34) crossed the zero line downwards
Rules of short entry:
Trend CCI (170) crossed the zero line downwards, is under her and shows a downward trend.
Entry CCI (34) crossed the zero line in the same direction and shows a downward trend.
RSI indicator value is less than 45
Heiken Ashi indicator changed color to red.
Exit the short position if the following conditions:
Heiken Ashi indicator changed color to blue
CCI (34) crossed the zero line upwards
Do not open trades against the trend on the M5 timeframe. Should also be considered Fibo and Pivot levels as support and resistance levels when deciding whether to enter on the market.
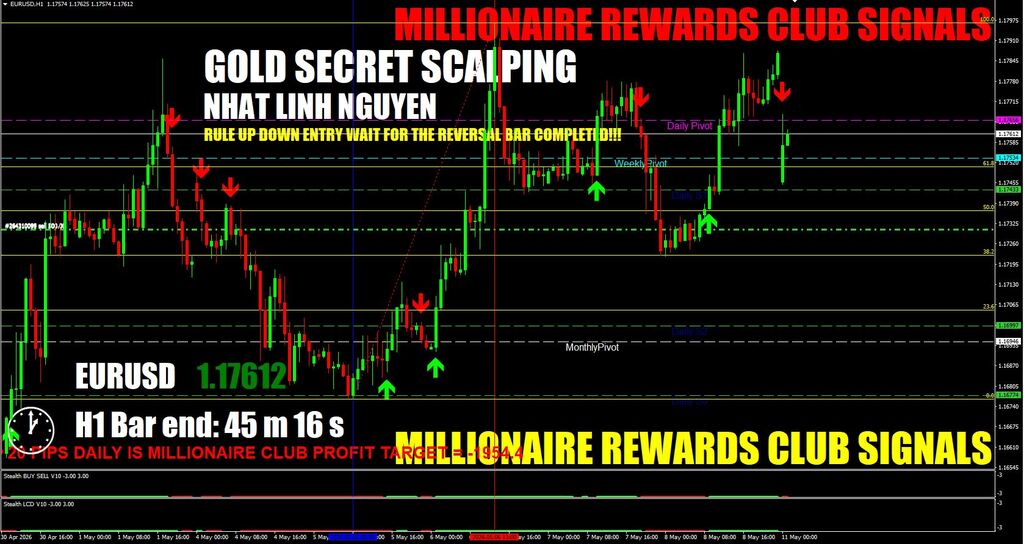
PRICE $1,000
66. GOLD SECRET SCALPING is a forex strategy that can be used for intraday scalping and can be used for longer-term trade. Stealth Forex consists of five main indicators and more suitable for major currency pairs.
Rules of entry into the market
Buy Entry, when the indicator Stealth BUY SELL and Stealth LCD turned green. At the same time histogram of indicator Stealth Hybrid too green and above the level of 0. Stealth Hybrid Line indicator directed upwards.
Exit during color changes to red at least one of the indicators Stealth BUY SELL or Stealth LCD.
Sell Entry, when the indicator Stealth BUY SELL and Stealth LCD turned red. At the same time histogram of indicator Stealth Hybrid also red and below 0. Stealth Hybrid Line indicator pointing down.
Exit during color change to green at least one of the indicators Stealth BUY SELL or Stealth LCD.
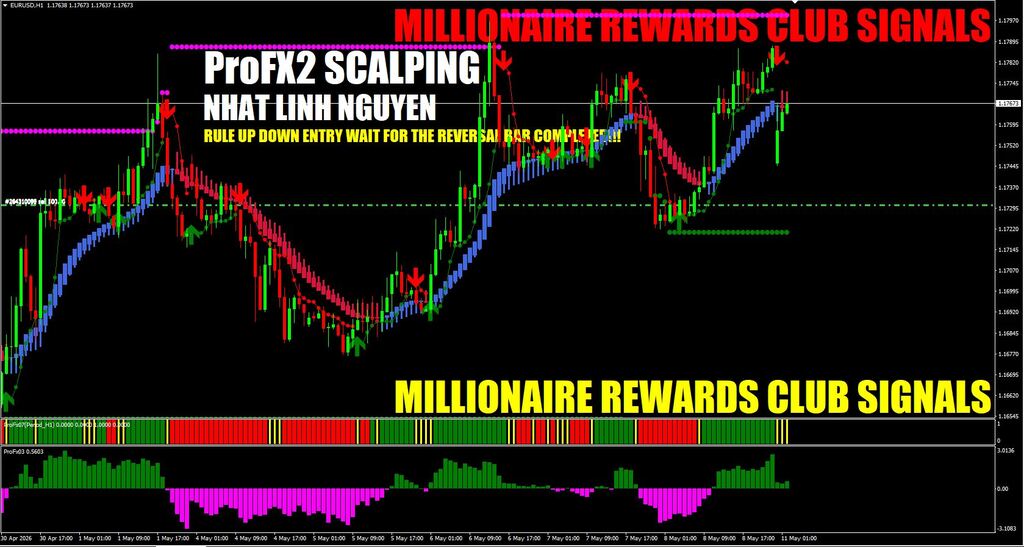
PRICE $1,000
67. Trading strategy ProFX2 is a trend system visually understandable and easy to use, so start trading on it will even novices to learn the rules. The risks are very low, the profitability of 7-15% per month.
Rules of strategy ProFX2
The basic rule system - open positions only on the condition that all indicators point in the same direction. In this case better to trade during European or U.S. session (because the trade is conducted on a pair GBPUSD - the impact of the Asian session will be minor and strong movements in this period on the pound almost never happens, so do not trade the Asian session!)
The developers recommend only trade in the direction of a larger trend that we observe in the timeframe H4. It is worth noting that it is often good movement on the M30 also occur against the trend and H4, and especially at the end of the trend H4, therefore - this condition is to choose from a trader
Check the economic calendar (red label opposite currency GBP and USD) and not trade for 30 minutes before and after the release of important news. During this period, the market may be highly unstable, so it is better to be here out of the market!
Rules for installation of Stop Loss:
Set Stop Loss at the last significant support/resistance level
Always install a real Stop Loss at the opening of the trade!
Never install a stop-loss above 100 points. Average stop-loss points 30-7
Rules to exit a trade:
Close trade if profit pair GBPUSD is 100 points
Close the trade, if the signal is reversed
Close the trade when important news
Close the trade at the end of U.S. session
You can also go ahead of schedule of the trade, if the indicator is ProFx05 above/below the level of 0.5/-0.5, respectively, while the indicator light ProFx06 changes from gray to green when the short position, or vice versa, provided the long position.
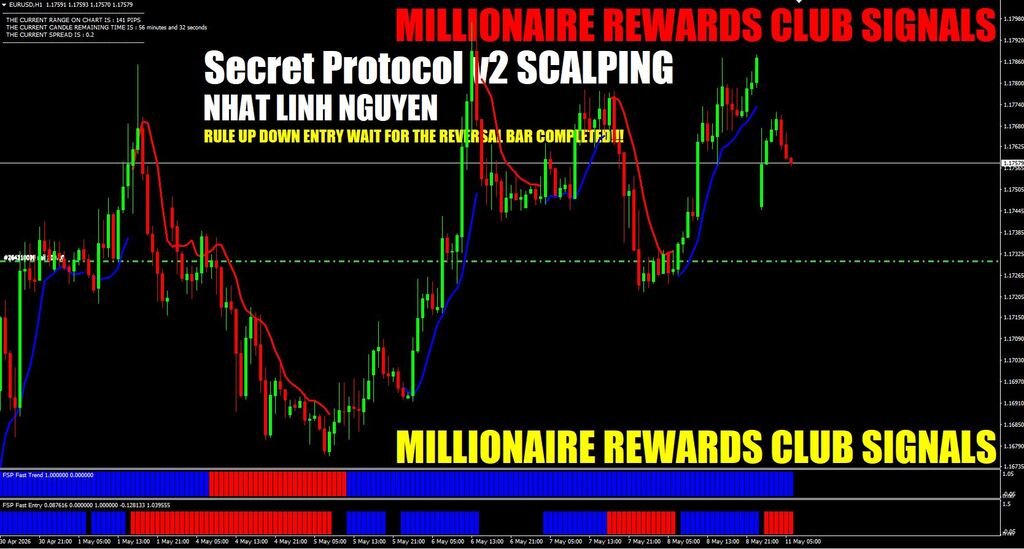
PRICE $1,000
68. Secret Protocol v2 Trading System consists of 11 indicators and is designed to trade on the timeframe M5 or higher. Forex Secret Protocol v2 (FSP v2) quickly gained popularity among a large number of traders because of its good results.
The system FSP v.2 can determine the long-term trend movement by the indicator FSP HTF Trend, and then use one of the rules of the strategy for opening positions (details in User Guide).
In general, the inputs in the long and short positions in the system intuitive and easy for you to understand them. See picture:
To open a Long position should be that the indicators turn blue. Exit during color changes to red:
To open a Short position should be that the indicators turned red. Exit during color changes to blue:
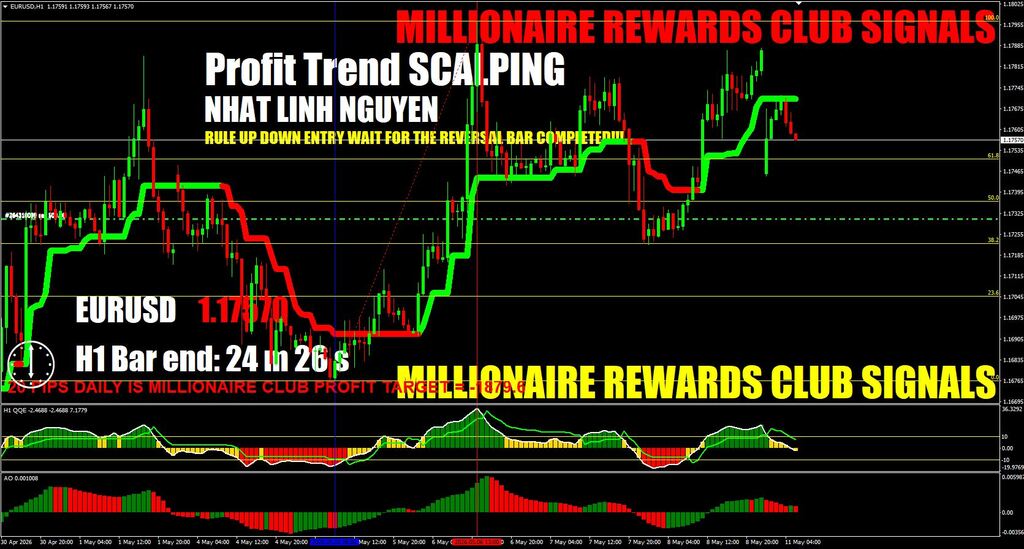
PRICE $1,000
69. Profit Trend trading strategy is a multicurrency forex system based on indicators.
Open Buy for strategy Profit Trend
Initially, wait when the indicator SuperTrend turns green.
Candle that interval, which is a trade is above the indicator SuperTrend and it's green.
Histogram indicator AO is green.
Histogram indicator QQE is green.
After completing the above conditions necessary to wait for closing the candle to all the conditions for the opening of the trade were confirmed.
After closing the candle with the above described terms, we open two trades for Buy equal shares, or a single trade, which will be closed in the future, in equal parts.
Closing position
To calculate the profit potential need from our signal closed candles (the closing price of the candle, which all received signals to enter the market) to install Fibonacci levels to the nearest minimum.
Profit on first order or partially close the trade (if one is open) at the level of 138.2% by Fibonacci.
At the same level in the level of swap bezubytka second order or second part of the remaining half of the trade. So we follow one of the basic principles of trade - "let your profits run."
In addition, you can transfer the foot two orders to breakeven, despite the forex indicator SuperTrend and his line, that is under it as long as stop loss will not appear slightly above the opening price of our positions.
Take-profit open the second part of the second order or the trade we put at 261.8, but still if the price reaches the second profit, then the remaining deal closes to breakeven (ie zero), so we do not lose anything, and at least part profit has already been closed due to the first order.
Stop Loss is set at the level of 50.0% by Fibonacci.
If forex indicator SuperTrend will turn red, the transaction is also closed, and it does not matter: it is now in profit or loss. Further wait the following signals for market entry.
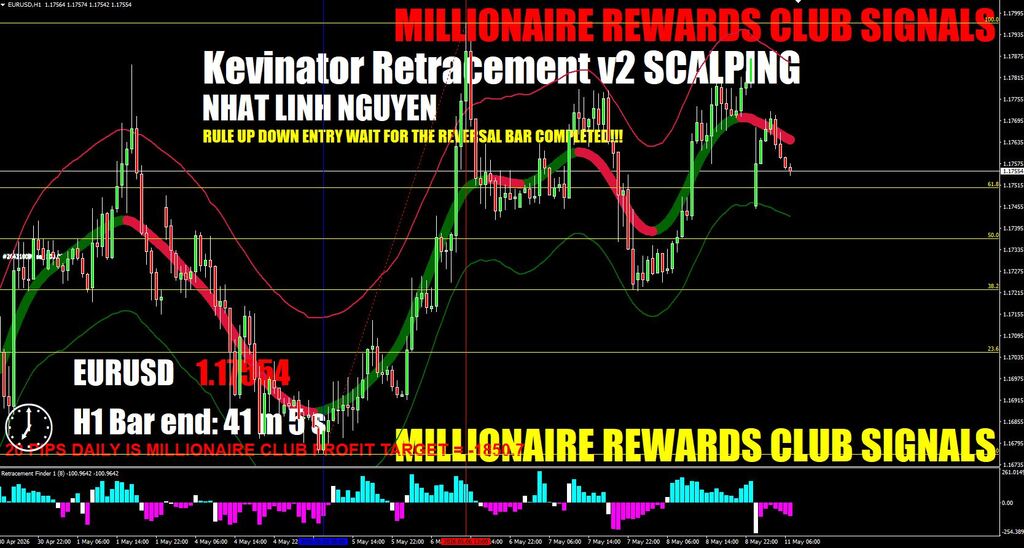
PRICE $1,000
70. At the heart of a trading strategy Kevinator Retracement based on the principle trade on pullbacks. This scalping strategy is designed to trade on major currency pairs.
Rules trade for strategy Kevinator Retracement
Open order Sell. To open an order for sale is necessary that the indicator TMA_centered_bands turn red decreases, which indicates to us on a downward trend, and we will only to open positions for sale, as well as on the indicator Retracement Finder has appeared White signal bar. In this opening position only after the closing of the signal candle.
Open order Buy. Opening buy orders when the yellow indicator line TMA_centered_bands turn Green increases, which indicates to us on an upward trend, as well as on the indicator Retracement Finder has appeared White signal bar. While also opening position only after closing the signal candle.
Closing positions can be performed in two methods, depending on what you like or more suitable. Closing positions can be performed either after the appearance White bar on the indicator Retracement Finder, which shows us the possibility of short changing the direction of price movement, either set Take Profit, which must be equal to 10-40 pips.
Stop Loss is set at 10-15 points.
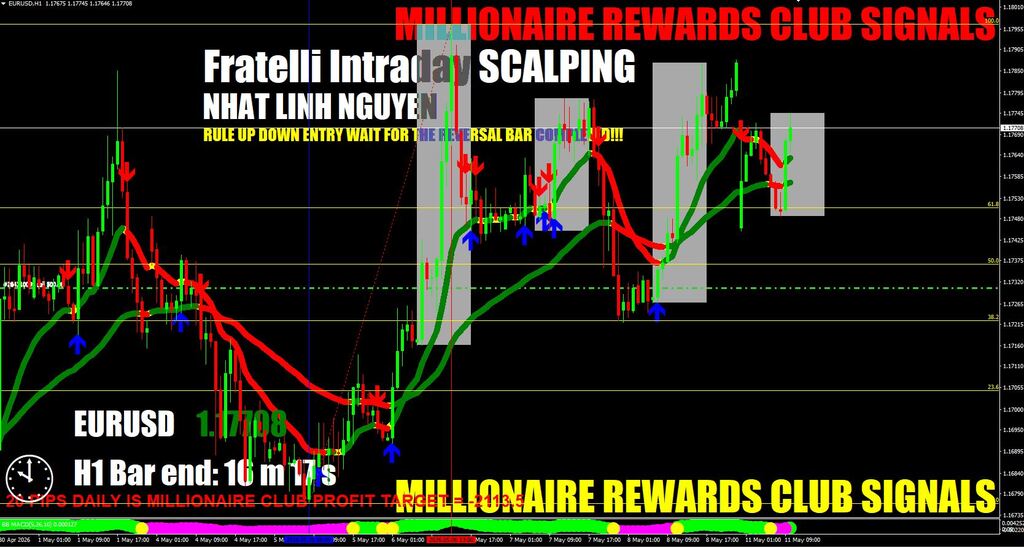
PRICE $1,000
71. Fratelli Intraday Trading System - intraday forex strategy, designed to trade mainly in the London session (by default, the system uses a gray area at 7:10-16:00 GMT) on M5 timeframe. To trade Fratelli Intraday trading system is better to use major currency pairs such as the EURUSD, GBPUSD, AUDUSD, EURCHF and others.
Open Buy, when candle of prices will turn green and closes above the black EMA (49). While indicator BB MACD should be green:
Open Sell, when candle of prices will turn red and closes above the white EMA (49). While indicator BB MACD should be red.
Stop Loss is set 20 pips.
Take Profit 20 pips too. When the price reaches 15 pips profit tolerated stop-loss at the level of opening position.
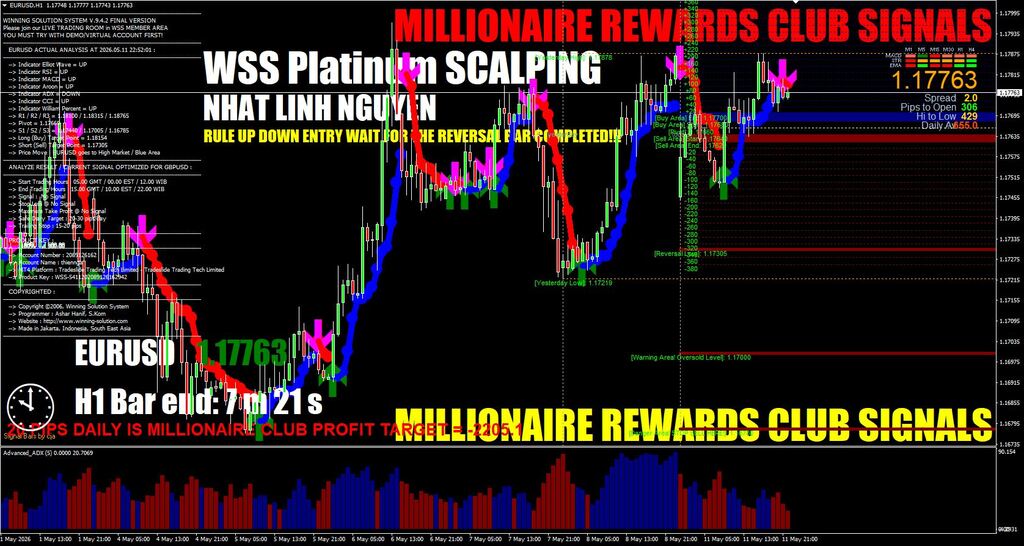
PRICE $1,000
72. WSS Platinum Trading Strategy authors positioned as an ideal set of indicators for a win-win trade. WSS - is a complex of 7 + 1 indicators summarizing analytical indicator + additional visualization on the chart. The strategy implemented WSS Platinum giving recommendations on entry and exit from the market using sound alerts.
Description of the interface strategy WSS Platinum:
Rules trade on the strategies WSS Platinum:
To minimize the risk, do not use more than 5% -10% of the deposit in per trade
Optimal results are obtained on GBPUSD, but you can experiment and other pairs
Before you do something, wait until the price go down or touch the gray zone (neutral)
Good time for trades: opening of Europe 07.00 - 10.00 GMT, the discovery of America 12.00 - 16.00 GMT
Red zone = a sell / short position / market down
Gray area = neutral area of support levels
Blue zone = buy / long position / market up
Strategy 20 pips (blue and red lines):
Open trade up or down according to the recommendations
Set Take Profit 10 - 20 pips for safe trading with a small risk
Set Take Profit of 20 pips on, if you are ready for more risk
Set Stop Loss at 40 - 60 pips
Strategy Breakout level (bold blue and bold red line):
You can Buy or Sell at break (only at the opening of Europe and America, or on the news)
Breakthrough strategy - Take Profit of 100 pips Stop Loss - 40, trailing stop 15-30 pips.
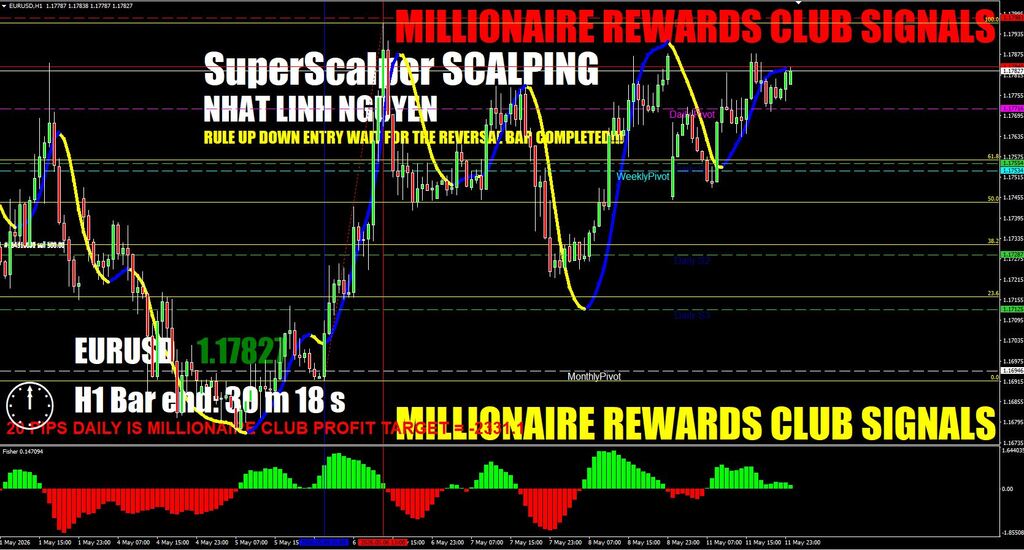
PRICE $1,000
73. SuperScalper is a very profitable scalping strategy and therefore it is very popular among traders. A little practice and you will feel the benefits of this system, you can based on it to build your own profitable scalping strategy by collecting it from various elements - for example, adding strategy SuperScalper trailing-stop from 1 pip or additional elements to better define the entry points to the trade.
Trading rules
For a position to Buy the first thing you must wait until crossing the blue line with red bottom-up, that will be evidence of an upward price movement. Fisher_Yur4ik indicator serves as a filter to determine the exact direction of the trend, and its color in this case should be green. Buy will open in compliance with the above conditions + color change indicator superscalper05 from yellow to blue. Color change indicator indicates the beginning of the upward movement in this market segment. Recommended Take-Profit - 10 points, but you cannot stand the restriction and close trade trailing stop from 1 to 5 points. Stop-loss at the opening of the transaction should stand at a distance of 15 points. Recommended to close the trade at if the indicator light "superscalper05" will change from blue to yellow or the opposite occurred moving average indicator SMA:
To open a position Sell reverse conditions. That is, the blue indicator line SMA must cross a red top down, indicating a downward trend. Fisher_Yur4ik indicator should be red, confirming the downward trend. When a color change indicator superscalper05 from blue to yellow will open Sell. Exiting of a trade is carried out when the laden with take-profit level, or change the red to blue SMA indicator:
An important rule strategy is that it is not recommended to enter trades when the price is between two moving averages, as it means there is no trend movement.
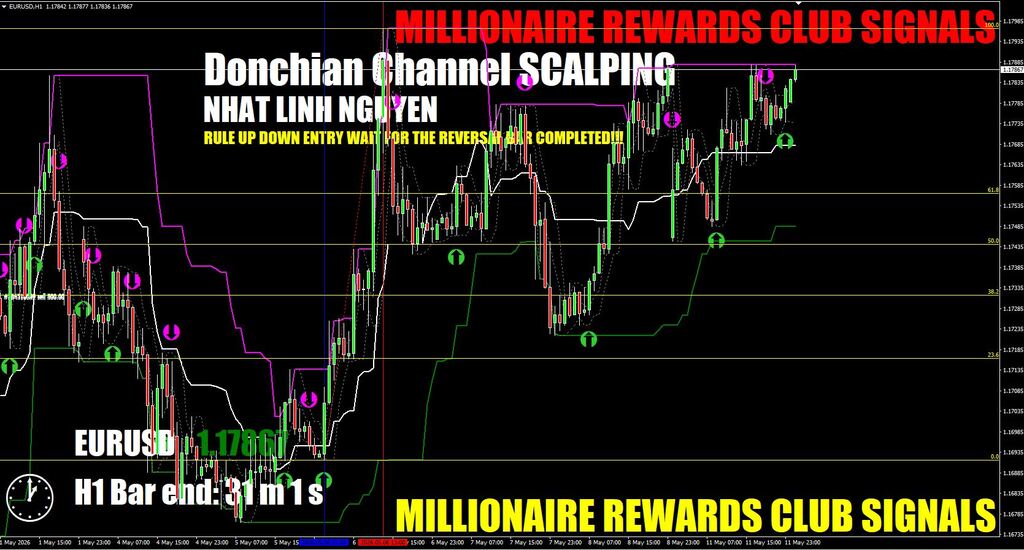
PRICE $1,000
74. Donchian Channel stands out among the most similar to each other trading systems the simplicity of calculations and easily readable trading signals.
The principle of the calculation of the channel, proposed back in the 70's, the author of the methodology by Richard Donchian, is to determine the maximum and minimum values of the price for a certain period. In this case, the calculation takes into account only the highest value and the lowest value of price, and on their basis construct two lines forming the price range.
To calculate the value of of the price range is important, only one parameter - the period during which the extremums are determined. The higher the value, the greater the range of bars of history will be used for their search. The author of a trading strategy recommended the use period = 20.
Since the Donchian Channel created for long-term trading, the value of 20 is chosen not by chance - it averaged the number of working days in a month. Establishment period of 20 candles, allows maximally consider the impact that it has on the market cyclical changes. But the cycle of 20 candles is equally effective when trading on the hourly time frame or even a quick scalping on the M5. To date, Donchian Channel finds its application in many trend trading systems, and the value of the period for the construction of the channel is taken in the range from 18 to 24 in the more complex options strategies, which simultaneously uses multiple Donchian Channels - for separate receive signals to the entry and exit value of the period can be 50 or more bars.
Rules of the trading system based on Donchian Channel:
Necessary open Long position and closed all short positions in the formation of the bar is higher than the upper line of Donchian Channel (blue).
Necessary open Short position and close all long positions in the formation of the bar below the bottom line of Donchian Channel (red).
Entry into the market is carried out on the closing prices of the last candle that broke the price range. But focusing only on these conditions, we obtain a large number of false breakout of the channel, and the profitability of the trading system will be negative.
For a trader change the channel width may act also a sign of the coming of a large trend. And if the periods of rising prices alternated with periods of their fall, so too quiet market will move in the lateral movement in a state of active growth or decline, and Donchian Channel will prompt the time of its beginning.
Despite all the shortcomings, a trading system based on algorithms Donchian can be profitable provided to solve the problem of a large number of false signals. It is sufficient to combine the construction of the channel on the basis of volatility and an oscillator that will help determine the strength of the pulse of the current trend. Add to the trading system indicator MACD.
Using the oscillator allows you to "filter out" the most false signals to the input, and when trading on the hourly time frame per day will open 2-3 trades, instead of 5-8, which reduces the requirements for the deposit, and also reduces the intensity of the trading process.
But even with such an embodiment, the use of the strategy Donchian`s is a significant lack. Since the channel and MACD well show themselves only in the presence of sufficient amplitude of price movements in the absence of of volatility MACD readings will be close to zero, and the width of the channel will not be sufficient for the timely detection of the beginning of a trend.
Simplicity of calculations used for the construction of the channel led to the creation of a large number of automated trading systems based on the algorithm of determining the price range Donchian. You can try out the (on the demo, of course) proposed indicator and advisor-scalper, who works for the timeframe M5.
Watch for adjusting the parameters responsible for the risk - lot size and distance orders, limiting losses. In the selection of the appropriate parameters, you can get up to 70% profitable trades.
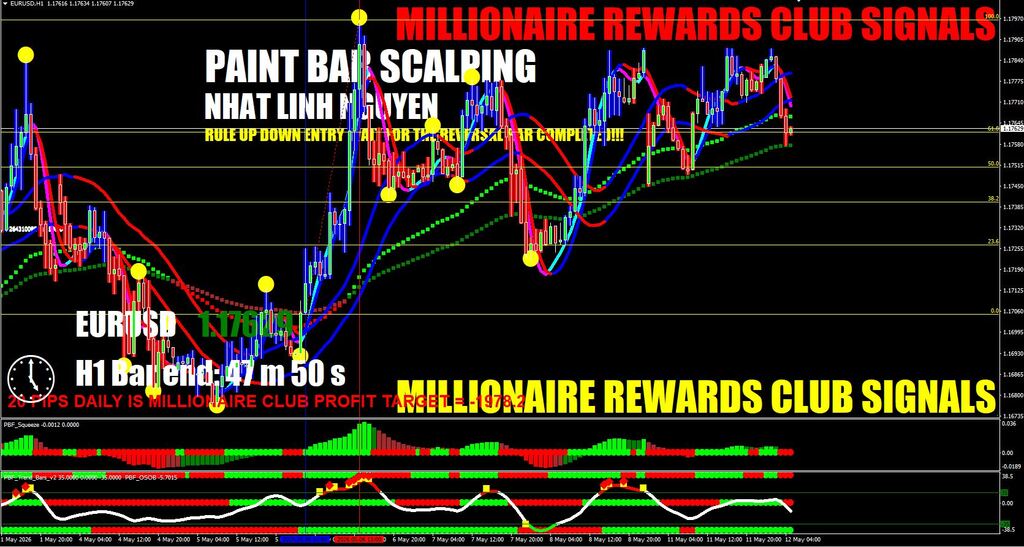
PRICE $1,000
75. Every trader dreams of have a profitable forex strategy, but not everyone can buy it for $ 2,000! That's how much it cost to Paint Bar Forex strategy and today you can download it from us for free. And you can see for yourself whether it is worth that kind of money?
Trading rules
Paint Bar Forex consists of 9 indicators, and at first glance it seems very complicated. But it is not. And you can see this. The archive is monual for work with this system, where the signals are described in detail and the rules strategy. You can download them at the bottom of this post.
So I will not describe in detail the rules of Paint Bar Forex. You can study them yourself in the Manual.
Example Open Buy:
Example Open Sell:
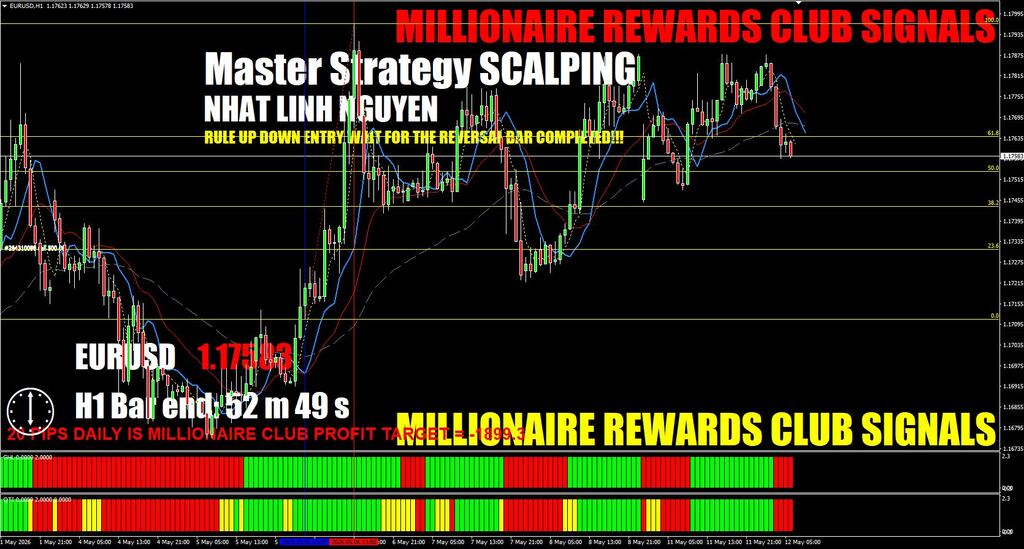
PRICE $1,000
76. The second article of the series on trading system Strategy Master (before learning this strategy is strongly recommend that you read the previous article in this series). Here you will learn about the first and most fundamental strategy - Power Trader, on the basis of which will already be built all the rest.
In the System Power Trader uses two screen (as an example we take a pair of time frames M5 and M15). On a larger time frame (M15) we will seek conditions for the trade, and youngest (M5) - directly entry point. Trade will be conducted in the direction of short-term and long-term trend in the larger time frame.
Signals indicating the open long position (Buy)
The entire process, from finding the prerequisites for entry into the market and ending with the closing of the trade consists of 10 steps. Let us consider each of them.
Step 1
On the larger timeframe (M15) Moving Averages and custom indicators (GHL and QTI) should form a specific set:
Price is above EMA 3
EMA 3 is located above the EMA 5
Price is above EMA 3
EMA 3 is located above the EMA 5
EMA 5 is located above the EMA 15
EMA 15 is located above the EMA 45
Indicator GHL is colored green
Indicator QTI is colored green
EMA 15 is located above the EMA 45
Indicator GHL is colored green
Indicator QTI is colored green
Step 2
On the larger timeframe (M15) price should revert and touch the moving average EMA 5.
When price touches the EMA 5, moving average EMA 3 very likely fall below EMA 5. There is nothing to worry about. Main thing that EMA 5 remained above the EMA 15 and EMA 15 remained above the EMA 45.
One of the most frequent questions: "Should the candle that touched the moving average closed below it?" The answer is - no. Candle in an uptrend, which concerns the EMA, will be bear (red).
At the intersection Price and EMA can draw a cross of horizontal and vertical lines to youngest TF see the point of intersection (this trick is especially useful when testing the system on historical data).
Step 3
Switch to a smaller time frame. As mentioned above, using this TF, we will take a trading decision. As was previously selected pair TF M5 and M15, therefore switch to M5.
Step 4
On the lower TF expect a buy signal.
Closing price of the candle should be above all the moving averages.
EMA 15 should be above 45 EMA.
Both custom indicators should be green.
Step 5
Switch on the senior timeframe in order to check whether there were bullish trend.
Rollback can sometimes be too deep and, in fact, it becomes not rollback, and reversal in the opposite direction. It works so filtering mechanism potentially losing trades. If, for example, on a larger time frame one (and the more both) custom indicators turned red or missing the correct location of the MAs, the trade should not go.
Step 6
Switched back to younger TF and determine the Stop Loss level.
In most cases, when you open the trade to Buy the Stop Loss is placed just below the nearest local minimum. But there are other options:
Stop-loss is placed below the moving average EMA 5.
Stop-loss is placed below all the moving averages.
One variant or another for Stop Loss can be selected depending on the market volatility.
Step 7
Open positions on a smaller TF.
When we know the Stop Loss level, we can easily calculate the level of risk and volume to enter the market (for ECN accounts for the Stop Loss level will expose a separate order).
Step 8
Determine the level of Take Profit.
If the Stop Loss is set at the level of the previous local minimum, Take Profit level should be selected in a 1:1 ratio. Upon closer Stop Loss (under moving average EMA 5), the ideal relationship between the Stop Loss and Take Profit - 2:1.
Step 9
Continue to control the position.
When inept management positions even successful trade can turn into a loss-making. As profit growth should gradually move the Stop Loss to the entry point. Another option when new candles the Stop Loss can be moved gradually moving average EMA 5. If the EMA does not remain in the horizontal position, the Stop Loss also remains at its original position.
Step 10 (Optional)
If necessary, use a trailing stop.
An alternative to a fixed take profit can serve as a trailing stop. In some cases, the profit can be increased in two, three or more times. However, it also happens that using trailing stop, have to be content with a few pips.
Question asked by many people (especially beginners) traders: "When I use a fixed take-profit, and when - trailing stop?" Answer to this question does not exist. The only option - a thorough testing of the trading system or follow your intuition in each case.
When you open a Short position all the rules should be the opposite.
What to do when the indicator QTI painted gray
When the indicator QTI painted gray (while maintaining the desired color of the indicator GHL), this case should be considered as favorable, in which you can open a position.
In such a scenario, usually on a time frame M5 violated the order of the moving averages, they intersect with each other (once again pay attention to that the indicator GHL on the M15 should be green).
Such trades a little more risky, but often successful. Even when crossing MAs on youngest time frame should wait until when candle closes below of all moving averages, and both custom indicator will be green (if the short position is the opposite).
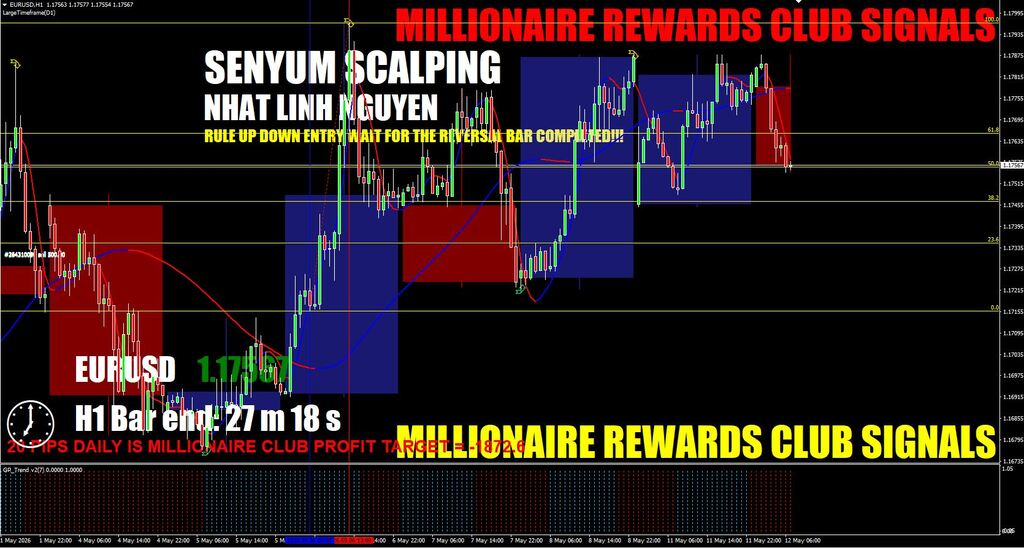
PRICE $1,000
77. Senyum Forex System “not changed” into small movements, and takes from the trend maximum profit. It allows her to make a great set of precise indicators, learning how to use that can even a novice.
Buy signal:
Price is in the blue zone.
Blue bar indicator show up in the histogram forex trend going up.
Open a long position when the Hull Moving Average indicator will turn blue.
Exit when the price will go down in the red zone.
Sell signal:
Price is in the red zone.
Red bar indicator show up the histogram forex trend going down.
Open a short position when the Hull Moving Average indicator will turn red.
Exit when the price will go down in the blue zone.
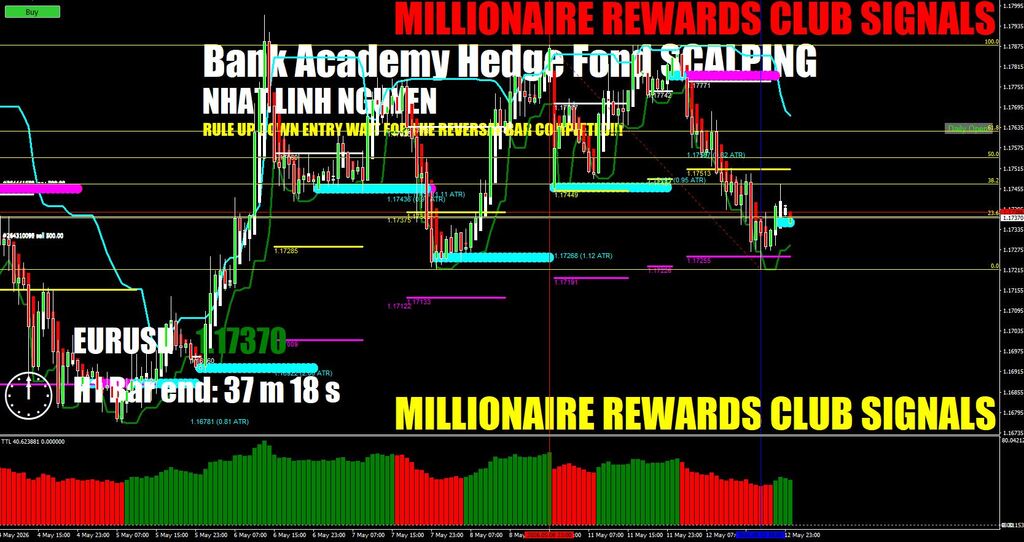
PRICE $1,000
78. USA Bank Academy FX Hedge Fund Strategy V1.0 is a fundamental trading system of major USA banks and hedge funds, which helps them to profitably manage the money of investors and depositors. The indicators of this strategy are not repainted at the onset of a new candle (bar), if the sellers of this strategy are to be believed. But when do the sellers tell the truth?
In addition, they claim that similar to how banks prioritize low risk and low exposure to capital while striving for high and very high potential earnings, this system operates with great precision. The rewards are substantial, with initial TP1 being 1:1 or 1:2, TP2 1:2 to 1:4, and TP3 staying open for potentially extremely large earnings up to 1:10.
Indicators of the System
USA Bank Academy FX Hedge Fund Strategy consists of three indicators:
1. DAILYOPEN the main indicator of the current trend, which indicates that we should consider only BUY (if the color is Aqua) or only SELL (if the color is Magenta).
2. TOP_Ultimate_Breakout - Alert and a set of colored lines and levels, which help in setting targets (TP) and Stop Loss and Trail SL levels:
The LIGHT BLUE LINE (AQUA) is where you can place your Stop Loss, and it's dynamic to adjust as price changes and can be used as a Trail SL.
The WHITE LINE is where you can place a BUY or SELL order.
Remember: When the price hits TP1, move your SL to break-even, then use the LIGHT BLUE LINE (AQUA) as your Trail SL.
3. TTL is an indicator, which colors the bars according to the current trend. Apply the "BUY is Green" or "SELL Red" if you want the candles to be more visible.
Trading rules
BUY INSTRUCTIONS:
Verify that the trend is for "BUY" (represented by blue bars).
When you spot a global trend (indicated by the bottom trend indicator), apply the "BUY TEMPLATE".
After the candle touches or crosses the "LIGHT BLUE LINE (AQUA)" following your previous trade close or Stop Loss activation, place a "BUY STOP" pending order on the "GREEN LINE" above the "LIGHT BLUE LINE (AQUA)".
When "BUY STOP" is triggered, you will see the network with "ENTER line (WHITE)," "TP1 line (YELLOW)", and "TP2 line (MAGENTA)". Place TP1 and TP2 there and place SL a few pips below "LIGHT BLUE LINE (AQUA)". For TP3, use Trail Stop and close it when price reaches "LIGHT BLUE LINE (AQUA)".
Note: It is recommended to enter a "BUY" manually or with a pending order in three separate orders to have three TPs (TP1/TP2/TP3).
Keep in mind: when price hits TP1, move SL to Break Even and after that use "LIGHT BLUE LINE (AQUA)" as your Trail SL.
As you can see, you have three TPs with a total of +1433 pips in the wave.
SELL INSTRUCTIONS:
Verify that the trend is for "SELL" (represented by magenta bars).
When you spot a global trend (indicated by the bottom trend indicator), apply the "SELL TEMPLATE".
After the candle touches or crosses the "LIGHT BLUE LINE (AQUA)" following your previous trade close or Stop Loss activation, place a "SELL STOP" pending order on the "GREEN LINE" below the "LIGHT BLUE LINE (AQUA)".
When "SELL STOP" is triggered, you will see the network with "ENTER line (WHITE)," "TP1 line (YELLOW)," and "TP2 line (MAGENTA)". Place TP1 and TP2 there and place SL a few pips above "LIGHT BLUE LINE (AQUA)." For TP3, use Trail Stop and close it when price reaches "LIGHT BLUE LINE (AQUA)".
Note: It is recommended to enter a "SELL" manually or with a pending order in three separate orders to have three TPs (TP1/TP2/TP3).
Keep in mind: when price hits TP1, move SL to Break Even and after that use "LIGHT BLUE LINE (AQUA)" as your Trail SL.
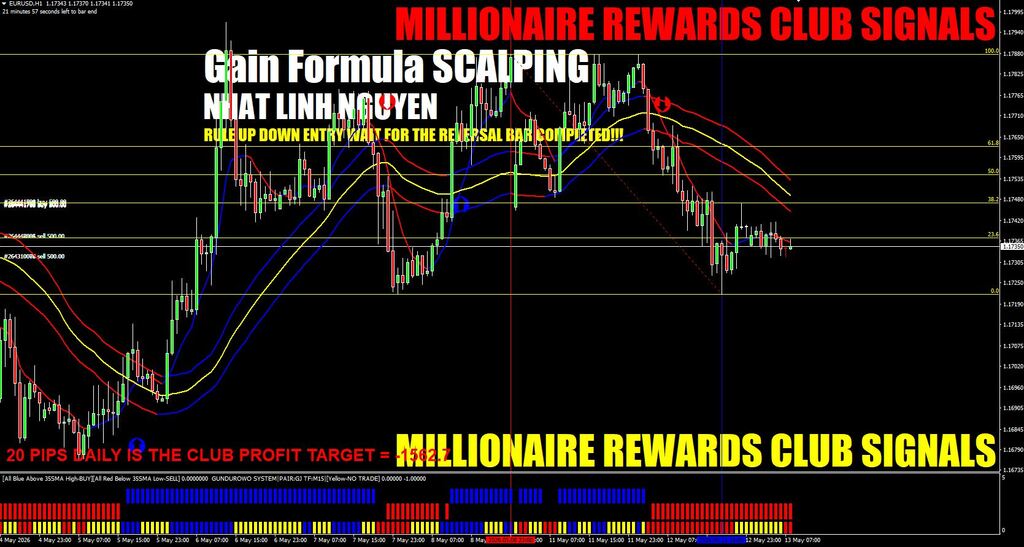
PRICE $1,000
79. Forex Gain Formula is a manual trading strategy that can be used to make money in the forex market every month. Forex Gain Formula MT4 Trading System was designed to be very simple and at the same time very powerful. And unlike most trading systems, the system is checked for prolonged testing and proved profitable even in the worst market conditions. The reason for this is that Forex Gain Formula was designed based on the most powerful trading methods such as trend-following and trading waves.
Rules of entry into the market by Forex Gain Formula
Go short:
Red candle bar closes below FGF_35SMA low line (you will receive
alert).
FGF_BURDYS and FGF_FBURD indicators draw red bar.
Go Long:
Blue candle bar closes above FGF_35SMA high line (you will
receive alert).
FGF_BURDYS and FGF_FBURD indicators draw blue bar.
Of course, this trading system with a competent approach and proper mani management can bring profit. But still you should protect yourself from possible losses as much as possible, having previously tested it on a demo account. And under no circumstances invest in trading funds that you cannot afford to lose painlessly.
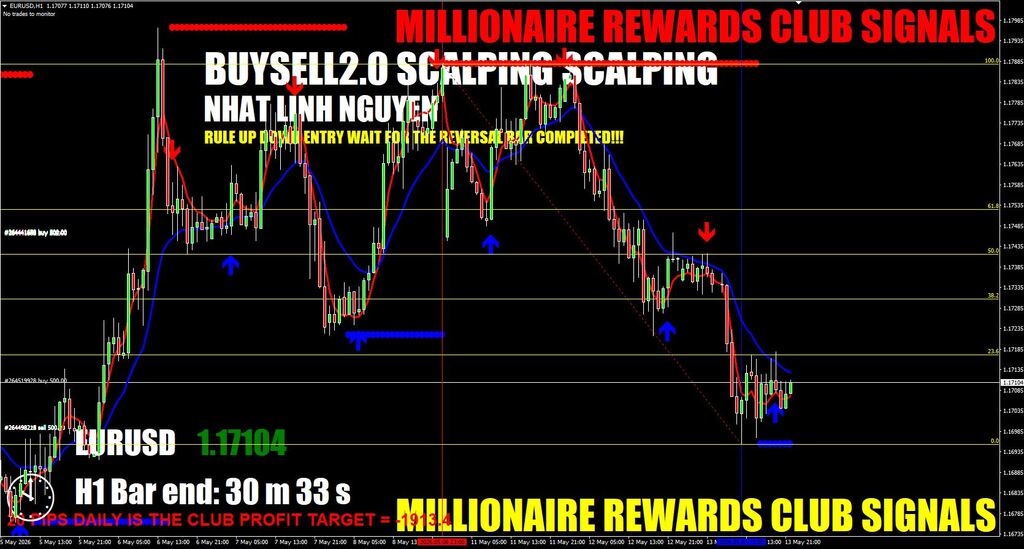
PRICE $1,000
80. BuySell2.0 strategy is based on the main indicator of Buy-Sell_Alerts, which indicates the direction of price movement by the arrows. Entrances to the positions carried out when a corresponding arrow and need go out with the appearance opposite direction arrow. All very simple and effective.
Rules of the strategy BuySell2.0
Open a short position when a red down arrow. Exit when a green reverse arrow.
Open a long position when a green up arrow. Exit when a red reverse arrow.
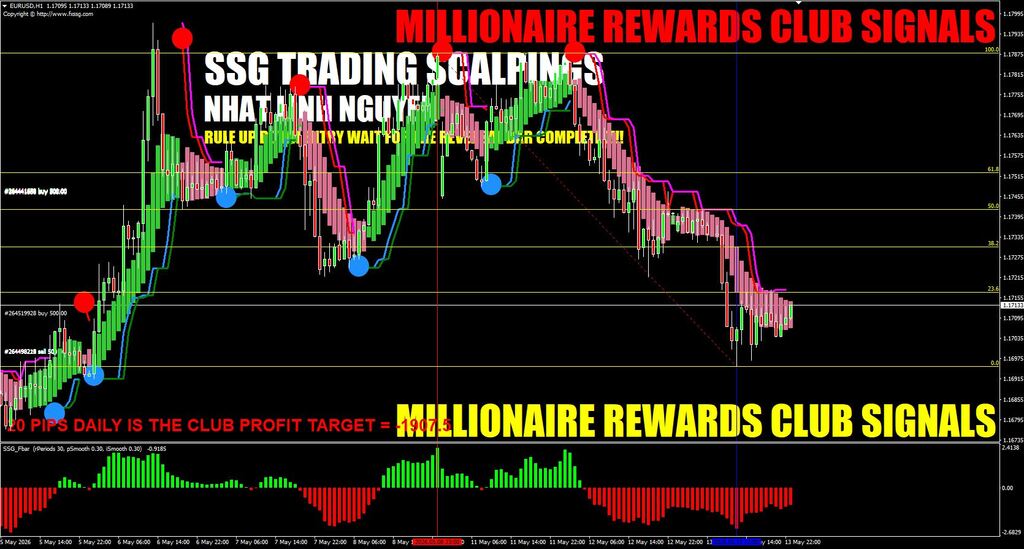
PRICE $1,000
81. Forex SSG System is a trend trading system for timeframes M30 higher Time Frames. This forex system with proper use it is able to make good profit in trading on the forex market.
Go short:
SSG Bline agree with SSG Fbar so as SSG HASignal is at sell direction.
SSG Bline Draw orange big dot as a direction change (WILL NOT REPAINT). Main indicator.
SSG Fbar cross 0 and goes below drawing red bar.
SSG HASignal is at confirmed direction white bars.
Talking about stoploss it is hard to tell. It depends on your money management rules. You could use previous high or low for placing stoploss. Also a trailing stop is a good choice.
You can wait for SSG Bline change to exit the trade. The point is that market tend to retrace and it is up to you how fast and how many pips you want to steal.
System DOES NOT REPAINT so you will get 84+ success in trades following strict rules.
Go long:
SSG Bline agree with SSG Fbar so as SSG HASignal is at buy direction.
SSG Bline Draw green big dot as a direction change (WILL NOT REPAINT). Main indicator
SSG Fbar cross 0 and goes above drawing green bar.
SSG HASignal is at confirmed direction blue bars.
One thing you should know is that system has settings. With a template it comes at custom settings which is optimized to work best from 30min to daily timeframe. If you will load indicators manually from indicators list you will not get settings as in pictures above. So we recommend you to load template first before backtesting indicators alone with other settings by your choice.
SSG Bline and SSG Fbar both comes with alert function also email alert included. Talking about trading pairs it is clear for all that Forex SSG System will work best with less volatility pairs as other stratagies.
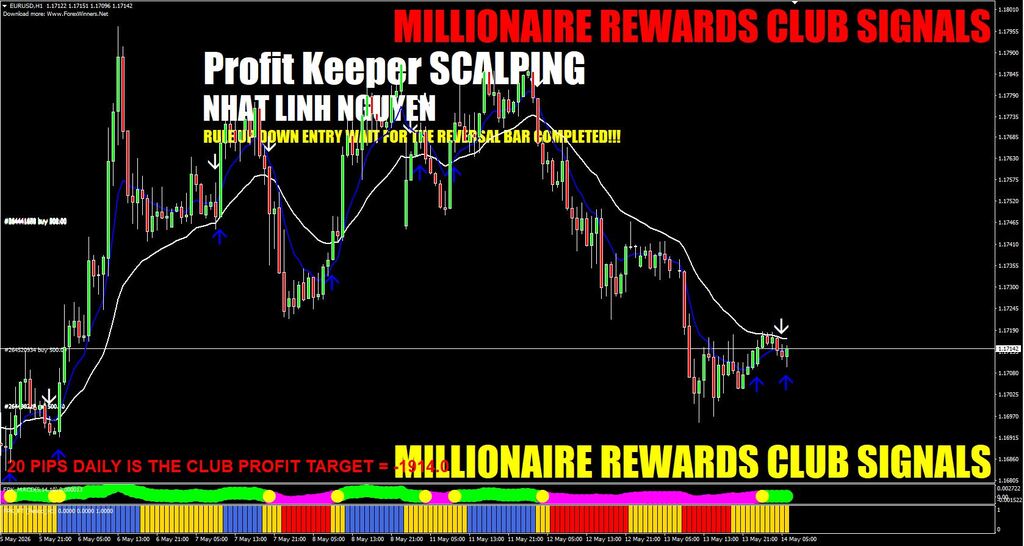
PRICE $1,000
82. Forex Profit Keeper system is well suited for intraday trading and scalping. In this strategy, no preference regarding currency pairs. But nevertheless Forex Profit Keeper is better to use on the major currency pairs. The system is very simple and consists of only 4 indicators.
Rules of entry into the market by Forex Profit Keeper
Go short:
Indicator FPK_Arrow pops white and points down
Indicator FPK_MACD goes below 0 line and draw first white dot after yellow one
Indicator FPK_FT draws red bar
Go Long:
Indicator FPK_Arrow pops blue and points up
Indicator FPK_MACD goes above 0 line and draw first blue dot after yellow one
Indicator FPK_FT draws blue bar
Exit trade when indicators turns agaist your trade direction. Trailing stop could be applied, stop loss for it depends on timeframe.
Stop loss should be placed at previous low or high.
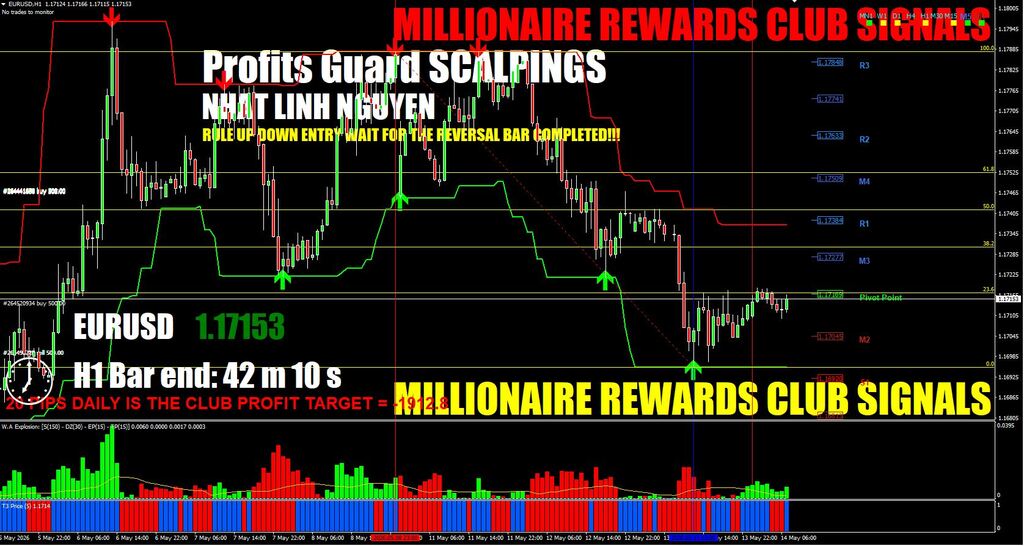
PRICE $1,000
83. Forex Profits Guard is not difficult and at the same time profitable forex strategy. Trade with its use can be in any currency pairs. Time frames for H1 and the lower the better to trade during the European session. On older time frames to trade around the clock.
Rules of entry into the market by Forex Profits Guard
Long position:
Painted green arrow up
WAExplosion indicator turns green
T3 2ColorHisto indicator turns green too
Exit, when a red arrow or change the color to red at least one of the indicators WAExplosion or T3 2ColorHisto.
Short position:
Painted red down arrow
WAExplosion indicator turns red
T3 2ColorHisto indicator turns red too
Exit, when a green arrow or a color change to green at least one of the indicators WAExplosion or T3 2ColorHisto.
Stop Loss should be set to 10 pips above / below the arrow. Take Profit - depending on the pair and time frame.
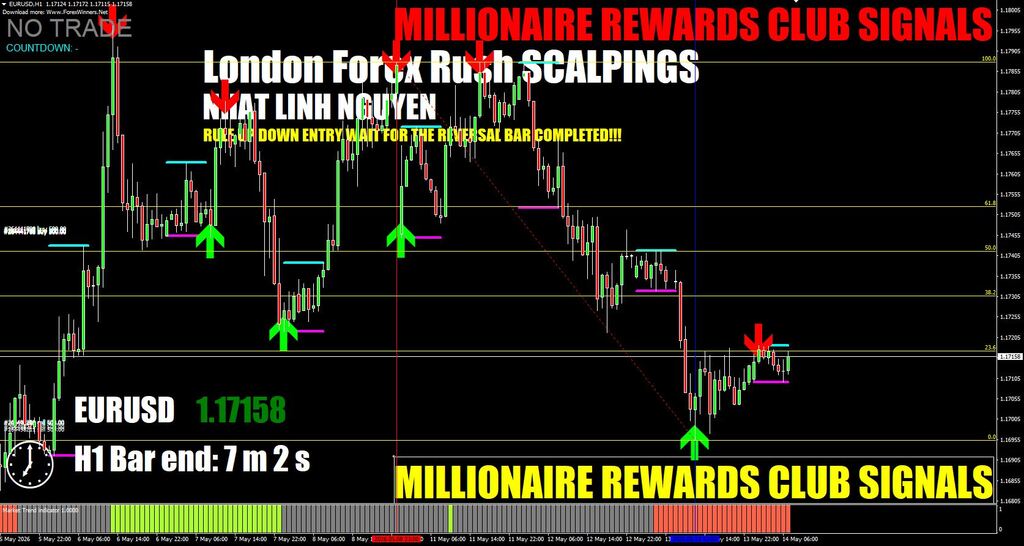
PRICE $1,000
84. London Forex Rush System is a profitable trading strategy based on observations of the price during the London session. Strategy London Forex Rush System can be used for most currency pairs.
Make the opening of trading positions need at the end of the Asian session or install Pending Orders after the close of the Asian session.
Many people know that the London session is the busiest in the currency market. Because it has the largest trade turnover:
At the time when after the a quiet Asian session start trading in London, the market taking place stronger price movements, which tend to in one direction (up or down):
This pattern of the market and is used in London Forex Rush System. We simply set the Pending Orders at High and Low of the Asian session (above / below 5 pips). After the one of the order will be opened, we remove the second order.
Of course, London Forex Rush System is a huge system with its own rules. More detailed information and you will get by reading manual, which you can download at the bottom of this article. In Manual are discussed rules in detail London Forex Rush System and some of the nuances of trade.

PRICE $1,000
85. Instant Buy Sell Signal is not complicated and intuitive indicator forex strategy. Arrow indicators Instant Buy Sell Signal will show you the direction to open a position. As the filter from the ranging market, there is no need to enter the market, are indicators at the bottom of the chart. Instant Buy Sell Signal is well suited for scalping and intraday trading.
Rules of entry into the market by Instant Buy Sell Signal
Open Long position, when there was a green arrow pointing upwards.
Open Short position, when there was a red arrow pointing down.
Exit at the Take Profit (for H1 - 20 pips), or when you see the opposite signal.
Stop Loss is set according to the inscription in the popup window of indicator.
Yet some of the nuances and peculiarities of setting indicators Instant Buy Sell Signal, you can read in the Manual which can be downloaded at the bottom of this article.
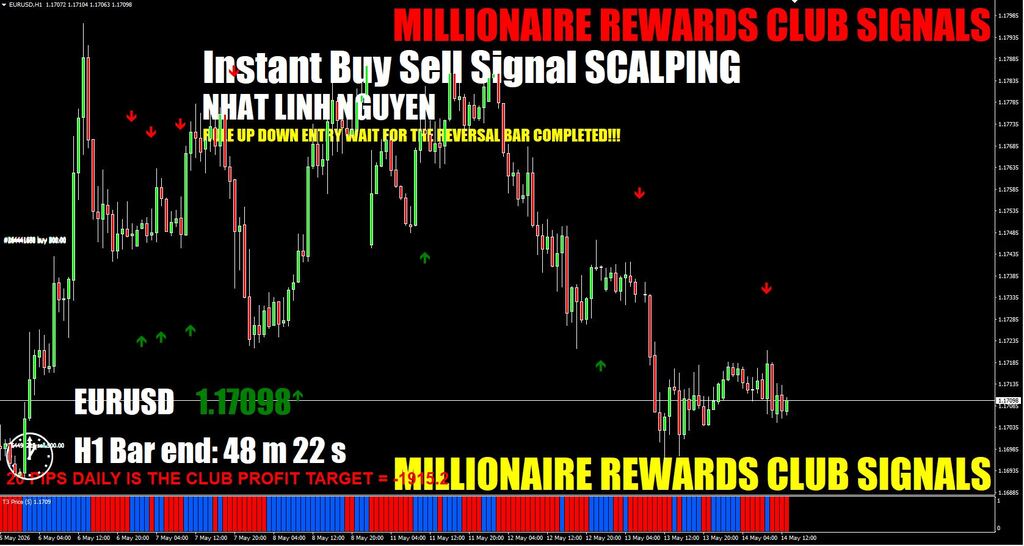
PRICE $1,000
86. Forex Smart Pips is an indicator forex strategy aimed at trend-following method. Therefore, it is better will approach to the volatile currency pairs on the not large time frames in European and American session.
Rules of entry into the market by Forex Smart Pips
Long position:
Dialog window appears with the corresponding signal
At the same time, blue and yellow MA crossed red MA bottom-up
Blue candle closes above the MA
Indicator Forex Smart Pips green
Exit during color change indicator Forex Smart Pips on red.
Short position:
Dialog window appears with the corresponding signal
At the same time, blue and yellow MA crossed red MA top down
Red candle closes below the MA
Indicator Forex Smart Pips red
Exit during color change indicator Forex Smart Pips on green.
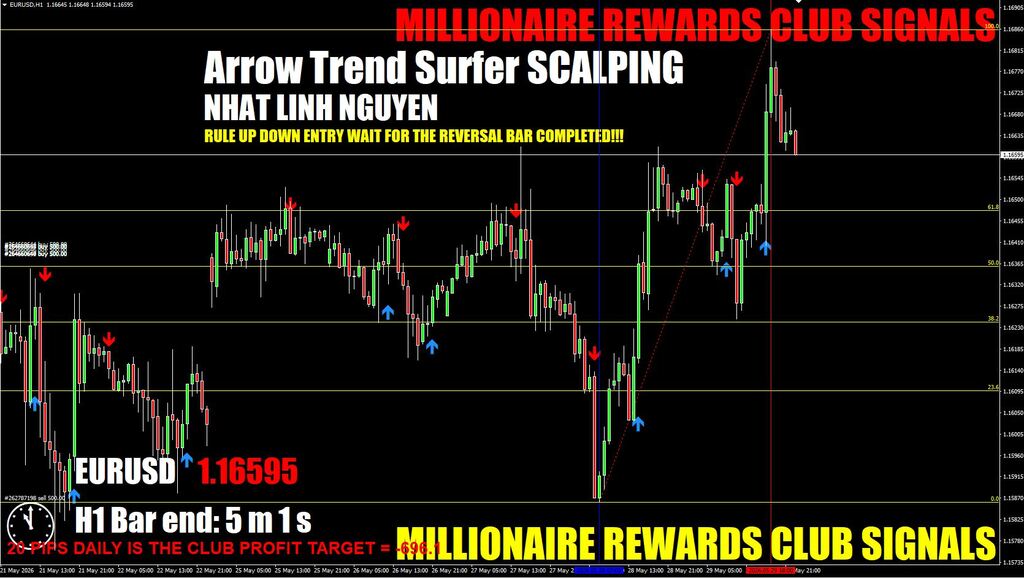
PRICE $1,000
87. Arrow Trend Surfer v 1.1 is a trend indicator that is designed to make it easier for a trader to find the future direction of price. The indicator helps to smooth out the price movement and eliminate the market noise to form a clearer picture of the existing trend and give you the best market entry point with + 95% accuracy!!! (These are the words of the seller). Is this even possible? The indicator is not repainted, which is not unimportant.
How it works? Trading rules
The indicator emits many signals. Some signals follow one after another literally in the interval of one candlestick or without an interval at all. This happens when the direction of the price contradicts the direction of the arrow. And then the indicator on the next candle gives out a new signal in the same direction. And here an additional filter involuntarily suggests itself.
Otherwise, trading is reduced to banal following the indicator signals:
BUY - blue up arrow.
SELL - red down arrow.
Stop Loss should be set a few pips above/below the local high/low:
Take Profit - depending on the time frame and volatility of the currency pair. On higher timeframes, a trailing stop can be used.
The author of the indicator claims that the indicator does not delayed. And here I will allow myself to disagree with this statement. Because it is clearly seen that the signals appear much later than the beginning of the trend. Sometimes, a signal appears when the trend has already subsided and a correction or reversal begins:
In the settings of the indicator, you cannot control the analysis of the market situation. There are simply no settings in the indicator parameters.
My analysis of the signals of this indicator has shown that the indicator can perform well in the short term. Within 1-3 candles. And therefore, in my opinion, Arrow Trend Surfer will be more interesting in scalping trading or binary options trading with an expiration of 1 candle. But in any case, before real trading, testing in real time on a demo account is imperative.
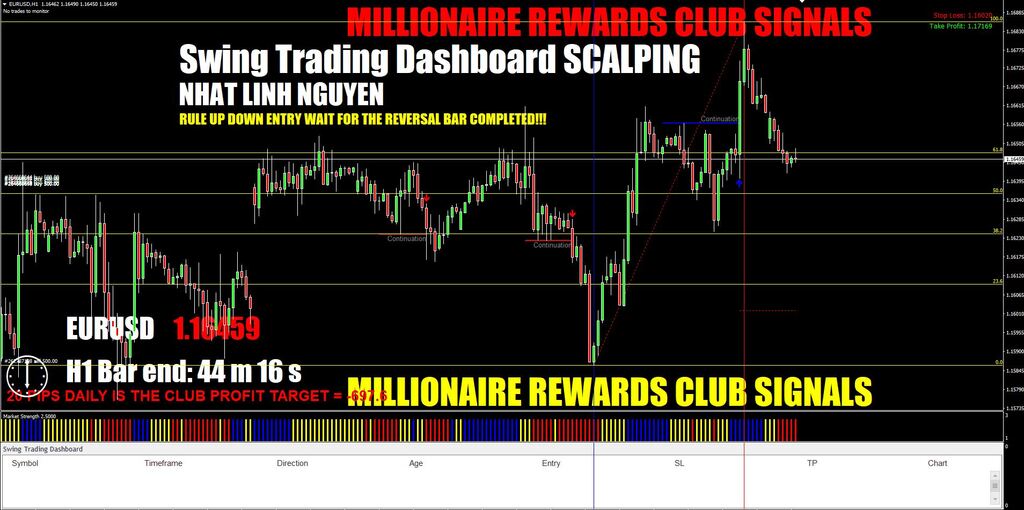
PRICE $1,000
88. Swing Trading Dashboard combines 2 powerful factors for finding reliable entry points to the market. This is a breakthrough from the support/resistance level and high-probability price action patterns. That is why the indicator accurately determines the turning points of the market and shows on the chart the emergence of a new market trend. The indicator is equally well suited for scalping, swing trading and day trading.
How it works and rules of trade
Before we proceed directly to the analysis of trading signals, I want to draw your attention to the fact that you do not need to open a new chart for each pair in the terminal each time. To do this, just double-click on the currency pair (gray area on the right with the name of the currency pair in the dashboard panel). It is very convenient and fast enough.
By the way, the forerunner of the Swing Dashboard Indicator was an indicator called the Swing Force (attached to the archive). I will not dwell on it in detail. If you wish, you can familiarize yourself with the Swing Force indicator.
Using the Swing Dashboard Indicator is very simple:
BUY when a blue arrow appears:
SELL when a red arrow appears:
Stop Loss should be set at the level of the red line, which in turn is set at the level of the nearest price minimum/maximum.
To set targets, you can follow the rules:
Take Profit 1 = Stop Loss
Take Profit 2 = 2 x Stop Loss or at the level of the green line of the indicator
And of course, no matter how profitable this indicator is, it is not wise to use it alone. For example, you can use the Market Strength indicator as a filter. This will additionally protect you from some false signals. Do not forget about Money Management.
Swing Trading Dashboard + Market Strength:
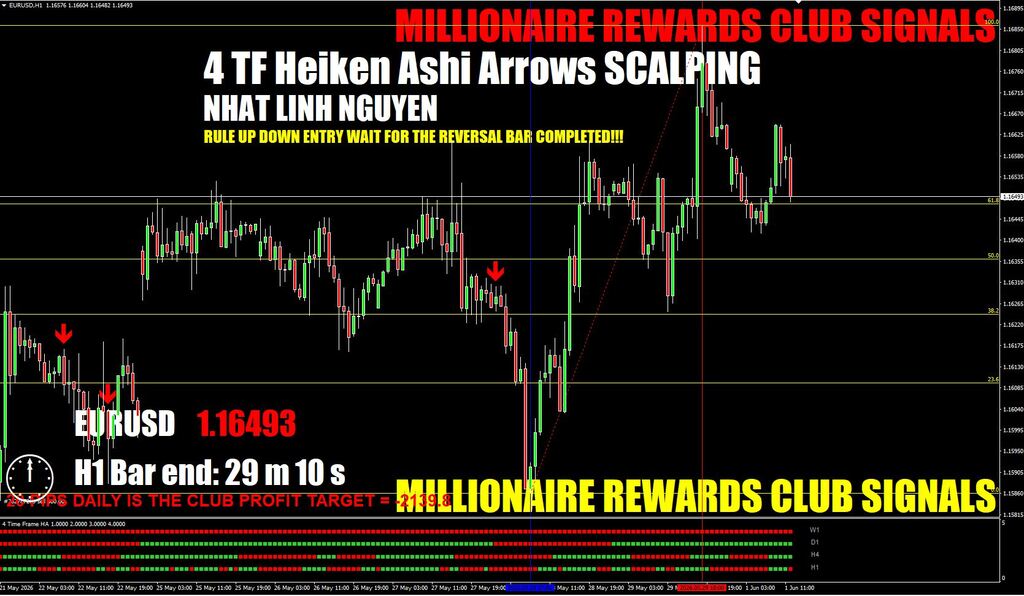
PRICE $1,000
89. 4 TF Heiken Ashi Arrows is a modified author's indicator (we say "thank you, Mobidik") based on the well-known indicator Heiken Ashi. 4 TF Heiken Ashi Arrows analyzes the 4 time frame (including the current TF) and generates a signal in the form of an arrow Buy or Sell. The indicator is equipped, already familiar to us, by the notification system: alert, a sound signal and an alert on an e-mail.
Rules of trade by the 4 TF Heiken Ashi Arrows
BUY - blue arrow:
SELL - red arrow:
Stop Loss is set at the nearest local minimum / maximum.
Take Profit is selected experimentally for each TF and currency pair.
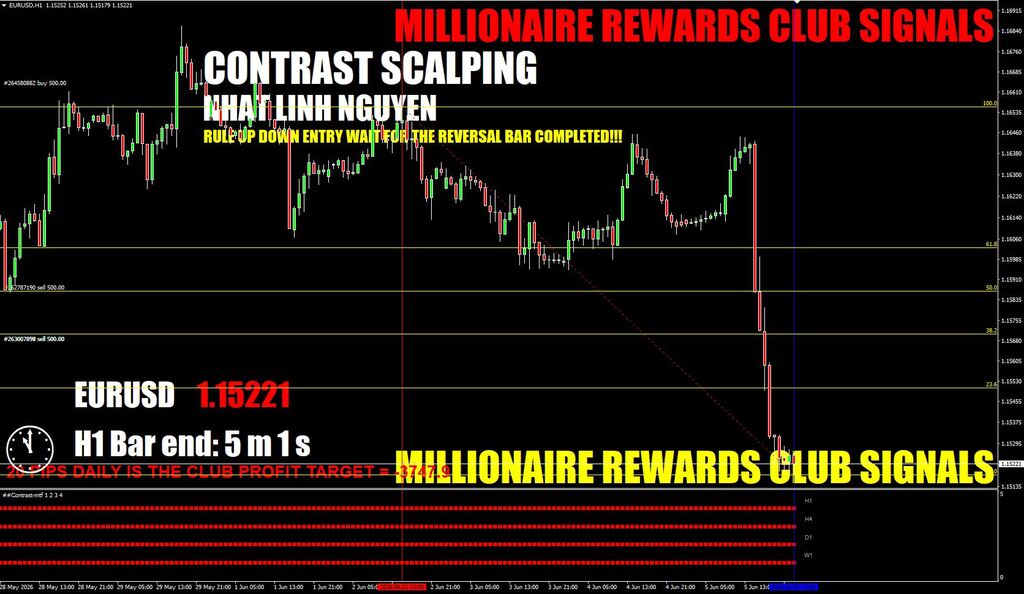
PRICE $1,000
90. Contrast Indicator perfectly suited for scalping and long-term trade. The main principle of the indicator lies in the definition of contrast. That is, to determine the true nature of the current movement, a comparison with the movement preceding it is necessary. This approach allows to catch new movements in the market, which are likely to continue.
How it works?
Contrast Indicator consists of two parts:
First (Contrast) - in the form of red and yellow lines on the likeness of the channel. This indicator has only one parameter in the settings - coeff. Increasing this parameter further spreads the lines between each other, and now they will need more time to cross. You can also set the coefficient with the minus sign (-), then the signals will appear more often. This function may be necessary for traders who trade binary options.
Second (Contrast-mtf) - in the form of a histogram in a lower window, which shows the values of the indicator from different timeframes. In the settings, you can also specify the coefficient and the values of four timeframes (next 1, next 2, next 3), including the current timeframe:
An important characteristic of the Contrast Indicator is that there is no repainting. Repaint only the value of the current bar and the entire history of the calculated remains valid even after a restart of the indicator or the terminal. Thus, the indicator is well suited for manual test on the history. And, therefore, the order should be opened on the next candle after crossing the lines.
The idea of the Contrast Indicator is based on two principles:
The future market movement cannot be predicted with a probability of more than 50%
The current trend will continue with a probability of more than 50%
That is, the probability that the entrance to the deal in the direction of the current trend will bring profit, is always somewhat higher than entering the market at random.
Rules of trade by the Contrast Indicator
BUY:
Yellow line crosses red from bottom to top
A green bar appears on the histogram
SELL:
Red line crosses yellow from bottom to top
A red bar appears on the histogram:
Contrast Indicator gives us directly the signal to enter the position. Thus, it remains for us to calculate the size of the StopLoss and TakeProfit. And of course we need additional filters. Alternatively, you can enter the market only when all 4 timeframes of the histogram show the signal in one direction. This will be the most accurate signal:
Before real trading, you must test it on a demo account.
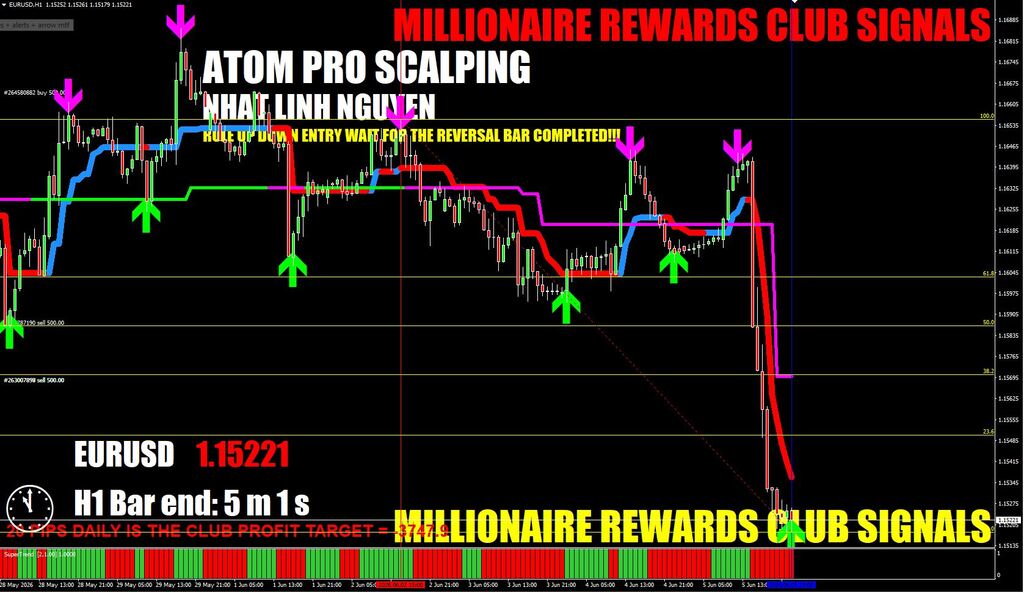
PRICE $1,000
91. Atom Pro is another indicator of Karl Dittmann, whom we know well from his trading products. Indicator is a line moving along with the price on the chart. The corresponding line color indicates the current price movement. The red color is a bearish trend (you should open a short position), the blue color is a bullish trend (you should open a long position). The indicator is equipped with an informational table, which displays the current trend, time, trading style and time before the current candle closes.
How it works?
As we know, any paid indicator is nothing more than a modified free indicator. Atom Pro is no exception. This indicator is based on the already familiar Super Trend (a detailed review here). Here's a comparison:
Of course, the author did a lot of work - he eliminated the repainting of the indicator, which is very, very important. The information board and the system of sound alerts and signals to the email were added. There is a possibility of setting the trading style (Conservative, Medium and Aggressive Mode) with different degrees of risk:
Indicator is more suitable for day trading than for scalping. But even at small timeframes, the indicator shows good results. The main disadvantage - flat. Therefore, it is necessary to trade on the major currency pairs in the most volatile trading time - London and New York.
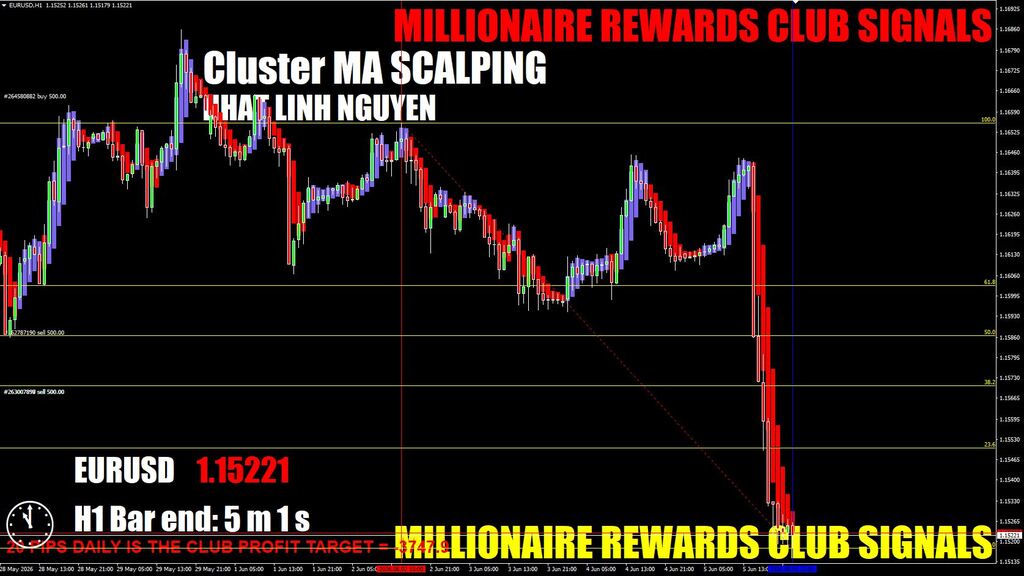
PRICE $1,000
92. Scalper Cluster Moving Averages is designed to visualize the direction of the trend. This indicator is deprived of delay and therefore very effective. Scalper Cluster Moving Averages determines the direction of the current trend using a cluster digital filter.
Rules of trade by Scalper Cluster MA
The Scalper Cluster Indicator analyzes the moving average data calculated (for prices: open, high, low, close) by the Cluster Filter indicator built on the basis of a cluster filter which is not delayed by time.
Of course, Scalper Cluster MA - is, first of all, the filter indicator. But it can also be the main indicator determining the entry point to the market. Blue color - open a long position. Red color - open a short position.
BUY:
SELL:
But to use it alone is not worth it, you should add additional filters. The Scalper Cluster MA indicator, due to the elimination of delay, can act as an effective filter in trading strategies.
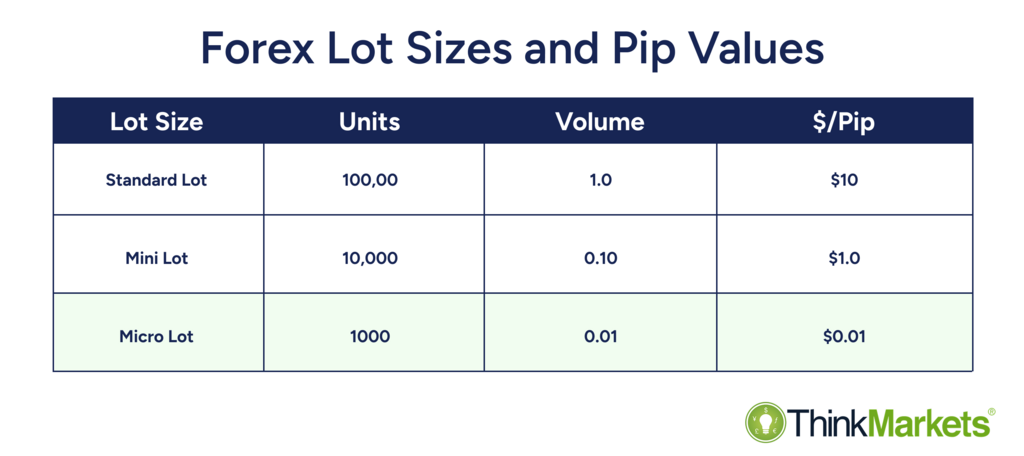


